29
/
en
AIzaSyAYiBZKx7MnpbEhh9jyipgxe19OcubqV5w
April 1, 2024
80618
Belarus
BLR
true
2
1
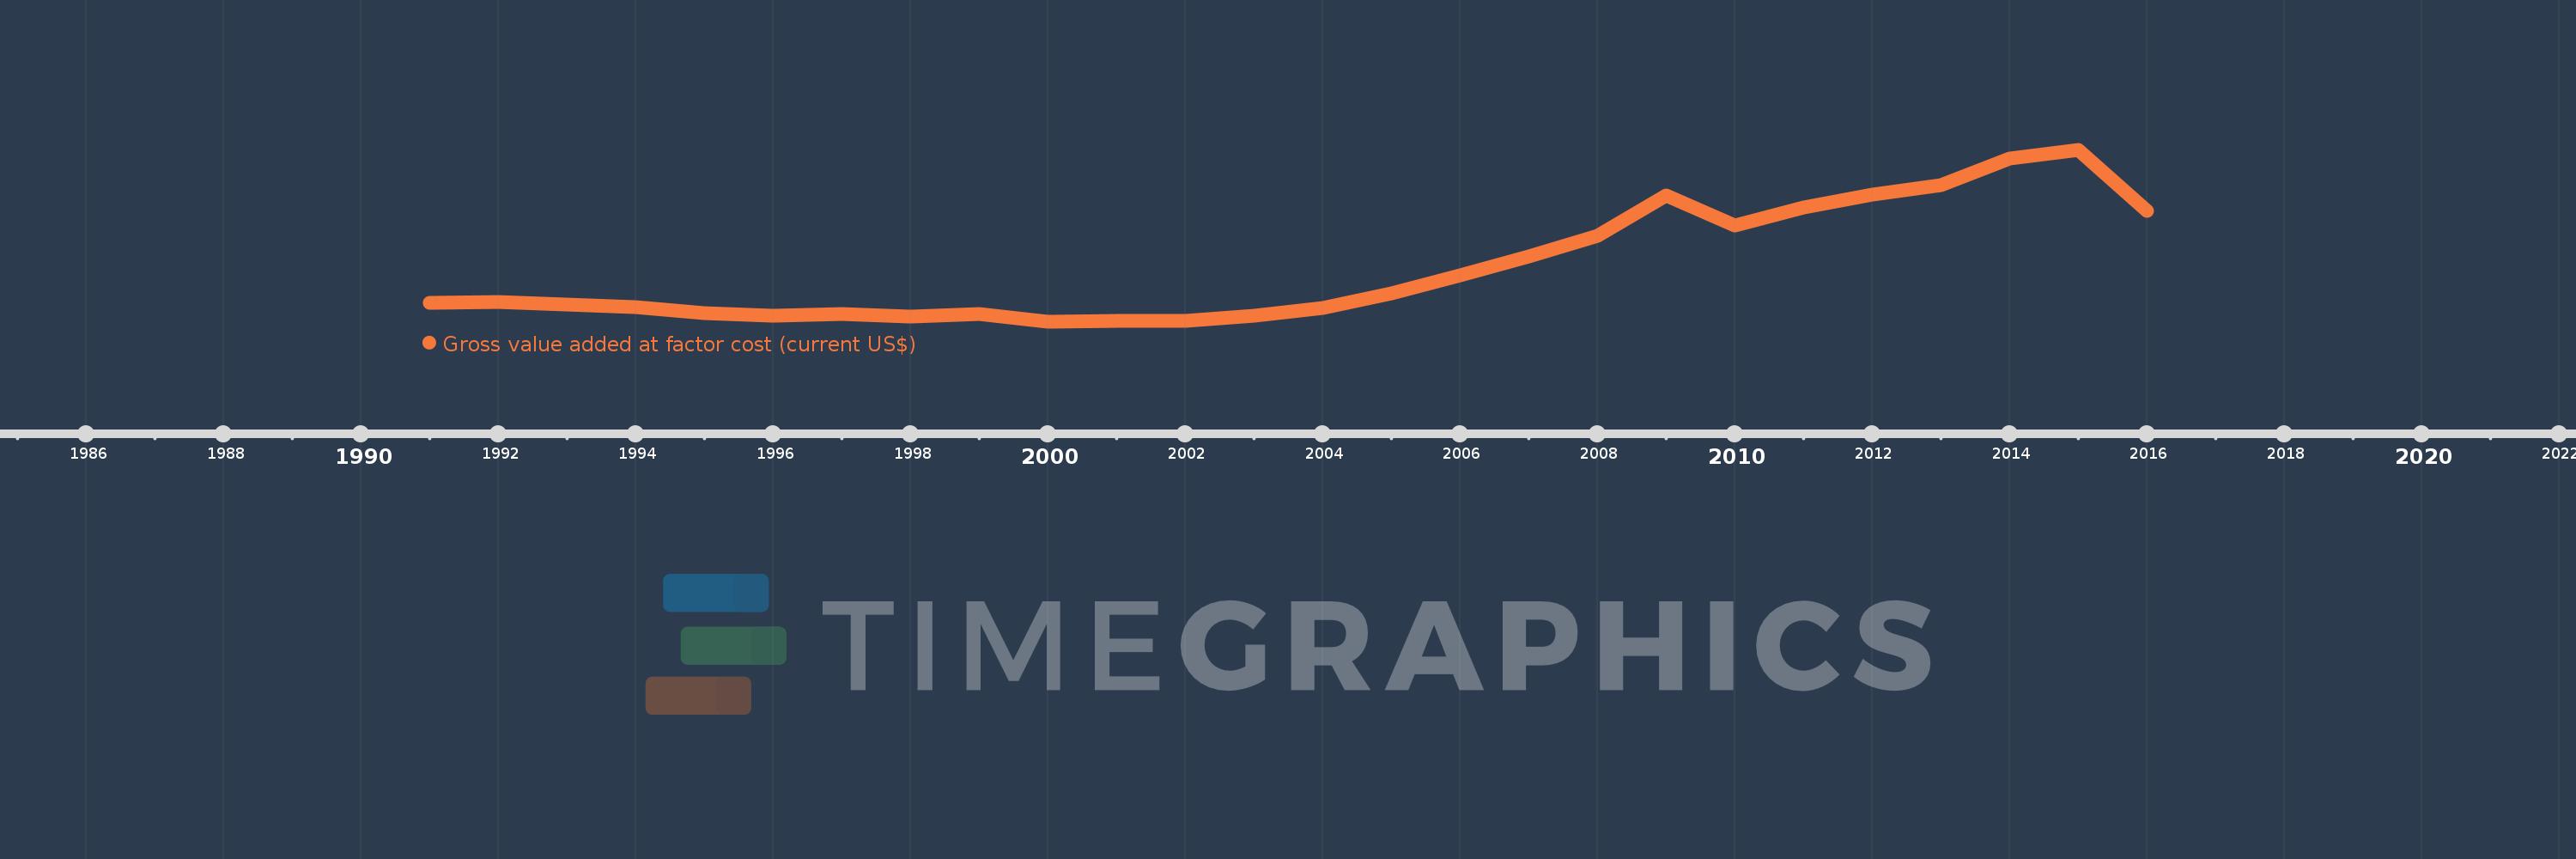
Gross value added at factor cost (current US$)
2016,2015,2014,2013,2012,2011,2010,2009,2008,2007,2006,2005,2004,2003,2002,2001,2000,1999,1998,1997,1996,1995,1994,1993,1992,1991
This statistics in other country:
AfghanistanAlbaniaAlgeriaAndorraAntigua and BarbudaArgentinaArmeniaArubaAustraliaAustriaAzerbaijanBahamas, TheBahrainBangladeshBarbadosBelarusBelgiumBelizeBeninBermudaBhutanBoliviaBosnia and HerzegovinaBotswanaBrazilBulgariaBurkina FasoBurundiCabo VerdeCambodiaCameroonCanadaCaribbean small statesCayman IslandsCentral African RepublicCentral Europe and the BalticsChadChileColombiaCongo, Dem. Rep.Costa RicaCroatiaCubaCyprusCzech RepublicDenmarkDjiboutiDominicaDominican RepublicEarly-demographic dividendEcuadorEgypt, Arab Rep.El SalvadorEquatorial GuineaEritreaEstoniaEthiopiaEuro areaEurope & Central AsiaEurope & Central Asia (excluding high income)Europe & Central Asia (IDA & IBRD countries)European UnionFaroe IslandsFijiFinlandFranceGabonGambia, TheGeorgiaGermanyGhanaGreeceGrenadaGuatemalaGuineaGuinea-BissauGuyanaHeavily indebted poor countries (HIPC)High incomeHondurasHong Kong SAR, ChinaHungaryIcelandIDA blendIDA onlyIDA totalIndiaIndonesiaIran, Islamic Rep.IrelandItalyJamaicaJapanJordanKazakhstanKenyaKiribatiKorea, Rep.KosovoKuwaitKyrgyz RepublicLao PDRLatin America & Caribbean Latin America & Caribbean (excluding high income)Latin America & the Caribbean (IDA & IBRD countries)LatviaLeast developed countries: UN classificationLebanonLesothoLiberiaLibyaLiechtensteinLithuaniaLow incomeLower middle incomeLuxembourgMacao SAR, ChinaMacedonia, FYRMadagascarMalawiMalaysiaMaldivesMaliMaltaMarshall IslandsMauritaniaMauritiusMexicoMicronesia, Fed. Sts.Middle East & North Africa (excluding high income)Middle East & North Africa (IDA & IBRD countries)MoldovaMongoliaMontenegroMoroccoMozambiqueNamibiaNepalNetherlandsNew ZealandNicaraguaNigeriaNorth AmericaNorwayOECD membersOmanPacific island small statesPakistanPalauPanamaPapua New GuineaParaguayPeruPolandPortugalPost-demographic dividendPre-demographic dividendRomaniaRussian FederationRwandaSao Tome and PrincipeSenegalSerbiaSeychellesSierra LeoneSingaporeSlovak RepublicSloveniaSolomon IslandsSouth AfricaSouth AsiaSouth Asia (IDA & IBRD)SpainSri LankaSt. Kitts and NevisSt. LuciaSt. Vincent and the GrenadinesSub-Saharan Africa Sub-Saharan Africa (excluding high income)Sub-Saharan Africa (IDA & IBRD countries)SudanSurinameSwazilandSwedenSwitzerlandSyrian Arab RepublicTajikistanTanzaniaThailandTimor-LesteTongaTrinidad and TobagoTunisiaTurkeyTurkmenistanTuvaluUgandaUkraineUnited KingdomUnited StatesUruguayUzbekistanVanuatuVenezuela, RBVietnamWest Bank and GazaWorldYemen, Rep.ZambiaZimbabwe Timeline:
This timeline shows a graph from 1991 to 2016 of Belarus. No data until 1990. Number of actual observations by date: 26.
Source name:
World Development Indicators
Source organization:
World Bank national accounts data, and OECD National Accounts data files.
Categories, topics:
Economy & Growth
Last updated:
apr 23, 2017
Indicators value changes by year
Minimum:
10.529 bln
jan 1, 2000
Maximum:
66.91 bln
jan 1, 2015
At the date of observation
Value
Absolute change
Change from previous value
jan 1, 1991
16.928 bln
+16.928 bln
0.0%
jan 1, 1992
17.098 bln
+169.243 mln
1.0%
jan 1, 1993
16.205 bln
-892.908 mln
-5.22%
jan 1, 1994
15.271 bln
-933.356 mln
-5.76%
jan 1, 1995
13.527 bln
-1.744 bln
-11.42%
jan 1, 1996
12.617 bln
-909.581 mln
-6.72%
jan 1, 1997
13.087 bln
+469.521 mln
3.72%
jan 1, 1998
12.328 bln
-759.069 mln
-5.8%
jan 1, 1999
13.235 bln
+907.744 mln
7.36%
jan 1, 2000
10.529 bln
-2.707 bln
-20.45%
jan 1, 2001
10.886 bln
+357.321 mln
3.39%
jan 1, 2002
10.769 bln
-117.544 mln
-1.08%
jan 1, 2003
12.554 bln
+1.785 bln
16.58%
jan 1, 2004
15.086 bln
+2.532 bln
20.17%
jan 1, 2005
19.829 bln
+4.743 bln
31.44%
jan 1, 2006
25.976 bln
+6.147 bln
31.0%
jan 1, 2007
32.016 bln
+6.039 bln
23.25%
jan 1, 2008
38.857 bln
+6.841 bln
21.37%
jan 1, 2009
51.932 bln
+13.076 bln
33.65%
jan 1, 2010
42.297 bln
-9.635 bln
-18.55%
jan 1, 2011
48.214 bln
+5.917 bln
13.99%
jan 1, 2012
52.458 bln
+4.244 bln
8.8%
jan 1, 2013
55.54 bln
+3.082 bln
5.87%
jan 1, 2014
64.136 bln
+8.596 bln
15.48%
jan 1, 2015
66.91 bln
+2.774 bln
4.33%
jan 1, 2016
47.12 bln
-19.79 bln
-29.58%
Ranking of countries by current statistics by years


Comments: