29
/
en
AIzaSyAYiBZKx7MnpbEhh9jyipgxe19OcubqV5w
April 1, 2024
266922
Trinidad and Tobago
TTO
true
2
1
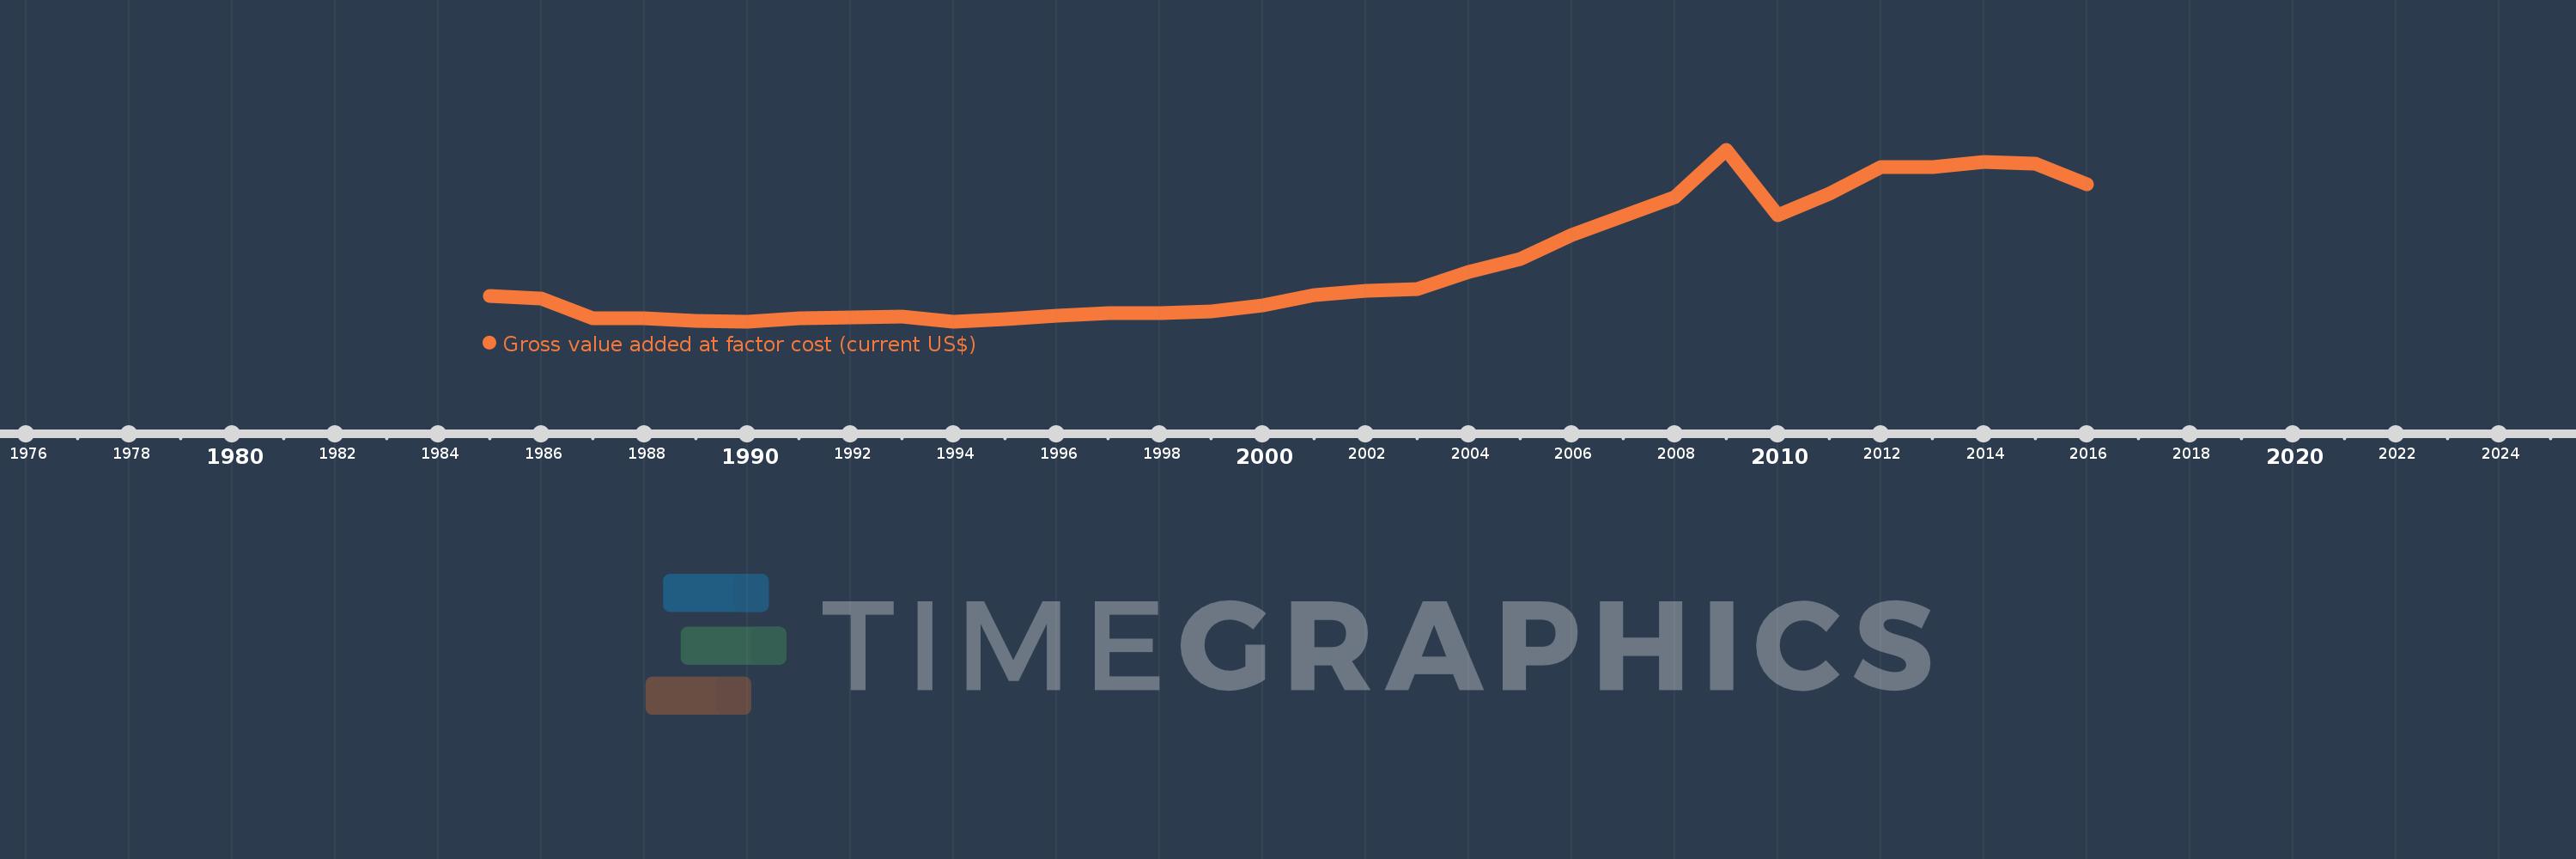
Gross value added at factor cost (current US$)
2016,2015,2014,2013,2012,2011,2010,2009,2008,2007,2006,2005,2004,2003,2002,2001,2000,1999,1998,1997,1996,1995,1994,1993,1992,1991,1990,1989,1988,1987,1986,1985
This statistics in other country:
AfghanistanAlbaniaAlgeriaAndorraAntigua and BarbudaArgentinaArmeniaArubaAustraliaAustriaAzerbaijanBahamas, TheBahrainBangladeshBarbadosBelarusBelgiumBelizeBeninBermudaBhutanBoliviaBosnia and HerzegovinaBotswanaBrazilBulgariaBurkina FasoBurundiCabo VerdeCambodiaCameroonCanadaCaribbean small statesCayman IslandsCentral African RepublicCentral Europe and the BalticsChadChileColombiaCongo, Dem. Rep.Costa RicaCroatiaCubaCyprusCzech RepublicDenmarkDjiboutiDominicaDominican RepublicEarly-demographic dividendEcuadorEgypt, Arab Rep.El SalvadorEquatorial GuineaEritreaEstoniaEthiopiaEuro areaEurope & Central AsiaEurope & Central Asia (excluding high income)Europe & Central Asia (IDA & IBRD countries)European UnionFaroe IslandsFijiFinlandFranceGabonGambia, TheGeorgiaGermanyGhanaGreeceGrenadaGuatemalaGuineaGuinea-BissauGuyanaHeavily indebted poor countries (HIPC)High incomeHondurasHong Kong SAR, ChinaHungaryIcelandIDA blendIDA onlyIDA totalIndiaIndonesiaIran, Islamic Rep.IrelandItalyJamaicaJapanJordanKazakhstanKenyaKiribatiKorea, Rep.KosovoKuwaitKyrgyz RepublicLao PDRLatin America & Caribbean Latin America & Caribbean (excluding high income)Latin America & the Caribbean (IDA & IBRD countries)LatviaLeast developed countries: UN classificationLebanonLesothoLiberiaLibyaLiechtensteinLithuaniaLow incomeLower middle incomeLuxembourgMacao SAR, ChinaMacedonia, FYRMadagascarMalawiMalaysiaMaldivesMaliMaltaMarshall IslandsMauritaniaMauritiusMexicoMicronesia, Fed. Sts.Middle East & North Africa (excluding high income)Middle East & North Africa (IDA & IBRD countries)MoldovaMongoliaMontenegroMoroccoMozambiqueNamibiaNepalNetherlandsNew ZealandNicaraguaNigeriaNorth AmericaNorwayOECD membersOmanPacific island small statesPakistanPalauPanamaPapua New GuineaParaguayPeruPolandPortugalPost-demographic dividendPre-demographic dividendRomaniaRussian FederationRwandaSao Tome and PrincipeSenegalSerbiaSeychellesSierra LeoneSingaporeSlovak RepublicSloveniaSolomon IslandsSouth AfricaSouth AsiaSouth Asia (IDA & IBRD)SpainSri LankaSt. Kitts and NevisSt. LuciaSt. Vincent and the GrenadinesSub-Saharan Africa Sub-Saharan Africa (excluding high income)Sub-Saharan Africa (IDA & IBRD countries)SudanSurinameSwazilandSwedenSwitzerlandSyrian Arab RepublicTajikistanTanzaniaThailandTimor-LesteTongaTrinidad and TobagoTunisiaTurkeyTurkmenistanTuvaluUgandaUkraineUnited KingdomUnited StatesUruguayUzbekistanVanuatuVenezuela, RBVietnamWest Bank and GazaWorldYemen, Rep.ZambiaZimbabwe Timeline:
This timeline shows a graph from 1985 to 2016 of Trinidad and Tobago. No data until 1984. Number of actual observations by date: 32.
Source name:
World Development Indicators
Source organization:
World Bank national accounts data, and OECD National Accounts data files.
Categories, topics:
Economy & Growth
Last updated:
apr 23, 2017
Indicators value changes by year
Minimum:
4.323 bln
jan 1, 1990
Maximum:
26.927 bln
jan 1, 2009
At the date of observation
Value
Absolute change
Change from previous value
jan 1, 1985
7.756 bln
+7.756 bln
0.0%
jan 1, 1986
7.376 bln
-380.167 mln
-4.9%
jan 1, 1987
4.794 bln
-2.582 bln
-35.0%
jan 1, 1988
4.798 bln
+3.389 mln
0.07%
jan 1, 1989
4.497 bln
-301.002 mln
-6.27%
jan 1, 1990
4.323 bln
-173.712 mln
-3.86%
jan 1, 1991
4.85 bln
+526.941 mln
12.19%
jan 1, 1992
4.955 bln
+105.13 mln
2.17%
jan 1, 1993
5.09 bln
+135.247 mln
2.73%
jan 1, 1994
4.364 bln
-726.353 mln
-14.27%
jan 1, 1995
4.735 bln
+370.713 mln
8.49%
jan 1, 1996
5.103 bln
+368.401 mln
7.78%
jan 1, 1997
5.524 bln
+420.974 mln
8.25%
jan 1, 1998
5.478 bln
-46.106 mln
-0.83%
jan 1, 1999
5.702 bln
+223.747 mln
4.08%
jan 1, 2000
6.5 bln
+798.311 mln
14.0%
jan 1, 2001
7.833 bln
+1.332 bln
20.5%
jan 1, 2002
8.475 bln
+642.823 mln
8.21%
jan 1, 2003
8.624 bln
+148.708 mln
1.75%
jan 1, 2004
10.93 bln
+2.306 bln
26.74%
jan 1, 2005
12.565 bln
+1.635 bln
14.96%
jan 1, 2006
15.801 bln
+3.236 bln
25.76%
jan 1, 2007
18.236 bln
+2.434 bln
15.4%
jan 1, 2008
20.799 bln
+2.564 bln
14.06%
jan 1, 2009
26.927 bln
+6.128 bln
29.46%
jan 1, 2010
18.361 bln
-8.565 bln
-31.81%
jan 1, 2011
21.177 bln
+2.815 bln
15.33%
jan 1, 2012
24.666 bln
+3.489 bln
16.48%
jan 1, 2013
24.709 bln
+42.659 mln
0.17%
jan 1, 2014
25.401 bln
+692.421 mln
2.8%
jan 1, 2015
25.176 bln
-225.113 mln
-0.89%
jan 1, 2016
22.433 bln
-2.743 bln
-10.89%
Ranking of countries by current statistics by years


Comments: