29
/
en
AIzaSyAYiBZKx7MnpbEhh9jyipgxe19OcubqV5w
April 1, 2024
182158
Luxembourg
LUX
true
2
1
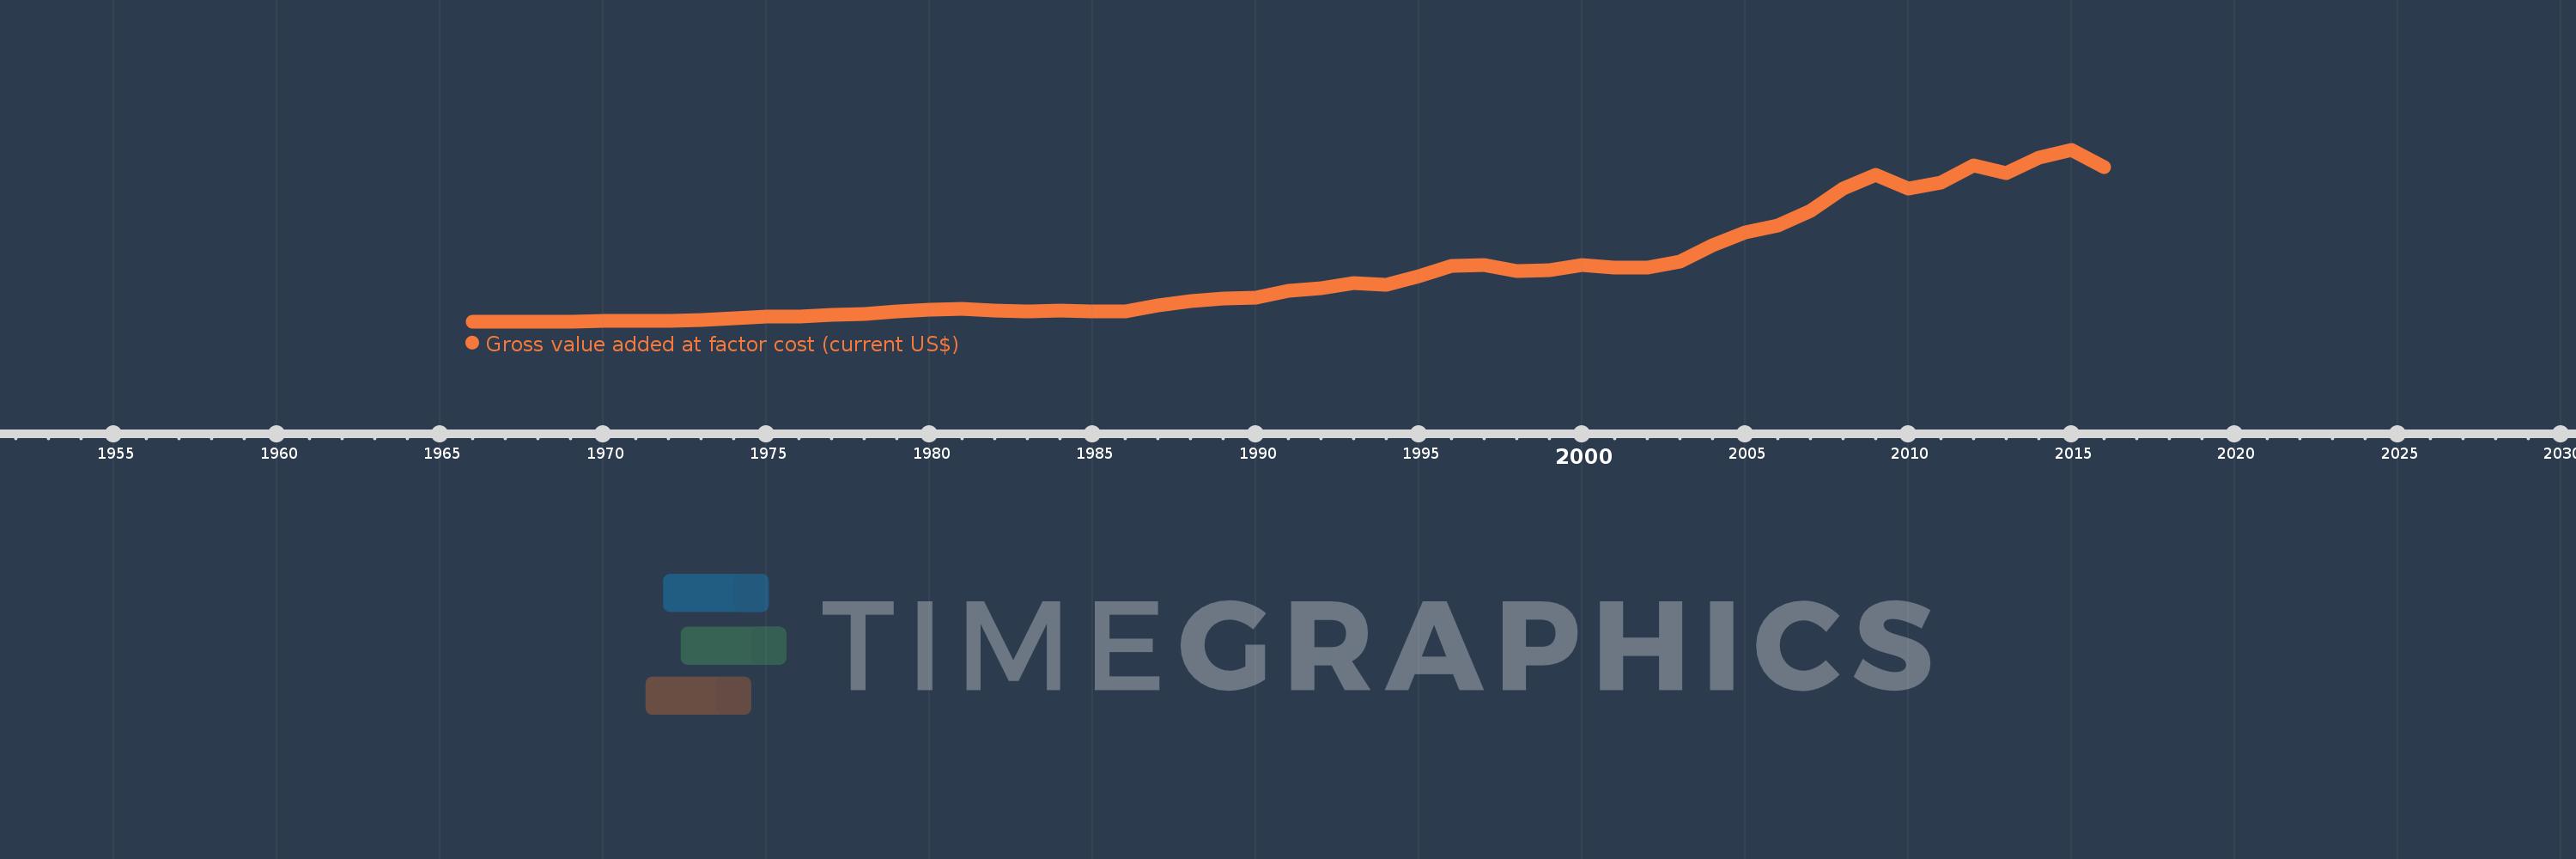
Gross value added at factor cost (current US$)
2016,2015,2014,2013,2012,2011,2010,2009,2008,2007,2006,2005,2004,2003,2002,2001,2000,1999,1998,1997,1996,1995,1994,1993,1992,1991,1990,1989,1988,1987,1986,1985,1984,1983,1982,1981,1980,1979,1978,1977,1976,1975,1974,1973,1972,1971,1970,1969,1968,1967,1966
This statistics in other country:
AfghanistanAlbaniaAlgeriaAndorraAntigua and BarbudaArgentinaArmeniaArubaAustraliaAustriaAzerbaijanBahamas, TheBahrainBangladeshBarbadosBelarusBelgiumBelizeBeninBermudaBhutanBoliviaBosnia and HerzegovinaBotswanaBrazilBulgariaBurkina FasoBurundiCabo VerdeCambodiaCameroonCanadaCaribbean small statesCayman IslandsCentral African RepublicCentral Europe and the BalticsChadChileColombiaCongo, Dem. Rep.Costa RicaCroatiaCubaCyprusCzech RepublicDenmarkDjiboutiDominicaDominican RepublicEarly-demographic dividendEcuadorEgypt, Arab Rep.El SalvadorEquatorial GuineaEritreaEstoniaEthiopiaEuro areaEurope & Central AsiaEurope & Central Asia (excluding high income)Europe & Central Asia (IDA & IBRD countries)European UnionFaroe IslandsFijiFinlandFranceGabonGambia, TheGeorgiaGermanyGhanaGreeceGrenadaGuatemalaGuineaGuinea-BissauGuyanaHeavily indebted poor countries (HIPC)High incomeHondurasHong Kong SAR, ChinaHungaryIcelandIDA blendIDA onlyIDA totalIndiaIndonesiaIran, Islamic Rep.IrelandItalyJamaicaJapanJordanKazakhstanKenyaKiribatiKorea, Rep.KosovoKuwaitKyrgyz RepublicLao PDRLatin America & Caribbean Latin America & Caribbean (excluding high income)Latin America & the Caribbean (IDA & IBRD countries)LatviaLeast developed countries: UN classificationLebanonLesothoLiberiaLibyaLiechtensteinLithuaniaLow incomeLower middle incomeLuxembourgMacao SAR, ChinaMacedonia, FYRMadagascarMalawiMalaysiaMaldivesMaliMaltaMarshall IslandsMauritaniaMauritiusMexicoMicronesia, Fed. Sts.Middle East & North Africa (excluding high income)Middle East & North Africa (IDA & IBRD countries)MoldovaMongoliaMontenegroMoroccoMozambiqueNamibiaNepalNetherlandsNew ZealandNicaraguaNigeriaNorth AmericaNorwayOECD membersOmanPacific island small statesPakistanPalauPanamaPapua New GuineaParaguayPeruPolandPortugalPost-demographic dividendPre-demographic dividendRomaniaRussian FederationRwandaSao Tome and PrincipeSenegalSerbiaSeychellesSierra LeoneSingaporeSlovak RepublicSloveniaSolomon IslandsSouth AfricaSouth AsiaSouth Asia (IDA & IBRD)SpainSri LankaSt. Kitts and NevisSt. LuciaSt. Vincent and the GrenadinesSub-Saharan Africa Sub-Saharan Africa (excluding high income)Sub-Saharan Africa (IDA & IBRD countries)SudanSurinameSwazilandSwedenSwitzerlandSyrian Arab RepublicTajikistanTanzaniaThailandTimor-LesteTongaTrinidad and TobagoTunisiaTurkeyTurkmenistanTuvaluUgandaUkraineUnited KingdomUnited StatesUruguayUzbekistanVanuatuVenezuela, RBVietnamWest Bank and GazaWorldYemen, Rep.ZambiaZimbabwe Timeline:
This timeline shows a graph from 1966 to 2016 of Luxembourg. No data until 1965. Number of actual observations by date: 51.
Source name:
World Development Indicators
Source organization:
World Bank national accounts data, and OECD National Accounts data files.
Categories, topics:
Economy & Growth
Last updated:
apr 23, 2017
Indicators value changes by year
Minimum:
894.709 mln
jan 1, 1966
Maximum:
57.89 bln
jan 1, 2015
At the date of observation
Value
Absolute change
Change from previous value
jan 1, 1966
894.709 mln
+894.709 mln
0.0%
jan 1, 1967
941.182 mln
+46.473 mln
5.19%
jan 1, 1968
946.844 mln
+5.662 mln
0.6%
jan 1, 1969
1.036 bln
+89.435 mln
9.45%
jan 1, 1970
1.199 bln
+162.584 mln
15.69%
jan 1, 1971
1.246 bln
+47.146 mln
3.93%
jan 1, 1972
1.29 bln
+43.591 mln
3.5%
jan 1, 1973
1.646 bln
+356.025 mln
27.61%
jan 1, 1974
2.225 bln
+578.89 mln
35.18%
jan 1, 1975
2.75 bln
+525.671 mln
23.63%
jan 1, 1976
2.826 bln
+75.34 mln
2.74%
jan 1, 1977
3.147 bln
+321.013 mln
11.36%
jan 1, 1978
3.549 bln
+402.514 mln
12.79%
jan 1, 1979
4.386 bln
+836.744 mln
23.58%
jan 1, 1980
4.997 bln
+611.053 mln
13.93%
jan 1, 1981
5.276 bln
+279.125 mln
5.59%
jan 1, 1982
4.548 bln
-728.377 mln
-13.81%
jan 1, 1983
4.534 bln
-13.527 mln
-0.3%
jan 1, 1984
4.593 bln
+58.605 mln
1.29%
jan 1, 1985
4.344 bln
-248.622 mln
-5.41%
jan 1, 1986
4.469 bln
+125.195 mln
2.88%
jan 1, 1987
6.383 bln
+1.913 bln
42.81%
jan 1, 1988
7.824 bln
+1.441 bln
22.58%
jan 1, 1989
8.653 bln
+828.904 mln
10.59%
jan 1, 1990
8.837 bln
+184.362 mln
2.13%
jan 1, 1991
11.176 bln
+2.339 bln
26.46%
jan 1, 1992
12.083 bln
+907.606 mln
8.12%
jan 1, 1993
13.686 bln
+1.603 bln
13.26%
jan 1, 1994
13.338 bln
-348.2 mln
-2.54%
jan 1, 1995
16.177 bln
+2.839 bln
21.29%
jan 1, 1996
19.466 bln
+3.289 bln
20.33%
jan 1, 1997
19.721 bln
+254.637 mln
1.31%
jan 1, 1998
17.741 bln
-1.979 bln
-10.04%
jan 1, 1999
18.128 bln
+387.022 mln
2.18%
jan 1, 2000
19.895 bln
+1.767 bln
9.75%
jan 1, 2001
18.895 bln
-999.767 mln
-5.03%
jan 1, 2002
18.978 bln
+82.747 mln
0.44%
jan 1, 2003
21.008 bln
+2.03 bln
10.7%
jan 1, 2004
26.263 bln
+5.255 bln
25.02%
jan 1, 2005
30.671 bln
+4.408 bln
16.78%
jan 1, 2006
32.979 bln
+2.308 bln
7.52%
jan 1, 2007
37.755 bln
+4.775 bln
14.48%
jan 1, 2008
45.216 bln
+7.462 bln
19.76%
jan 1, 2009
49.64 bln
+4.424 bln
9.78%
jan 1, 2010
45.292 bln
-4.347 bln
-8.76%
jan 1, 2011
47.262 bln
+1.97 bln
4.35%
jan 1, 2012
52.846 bln
+5.584 bln
11.81%
jan 1, 2013
50.228 bln
-2.618 bln
-4.95%
jan 1, 2014
55.415 bln
+5.187 bln
10.33%
jan 1, 2015
57.89 bln
+2.475 bln
4.47%
jan 1, 2016
52.311 bln
-5.578 bln
-9.64%
Ranking of countries by current statistics by years


Comments: