29
/
en
AIzaSyAYiBZKx7MnpbEhh9jyipgxe19OcubqV5w
April 1, 2024
24946
Caribbean small states
CSS
false
2
1
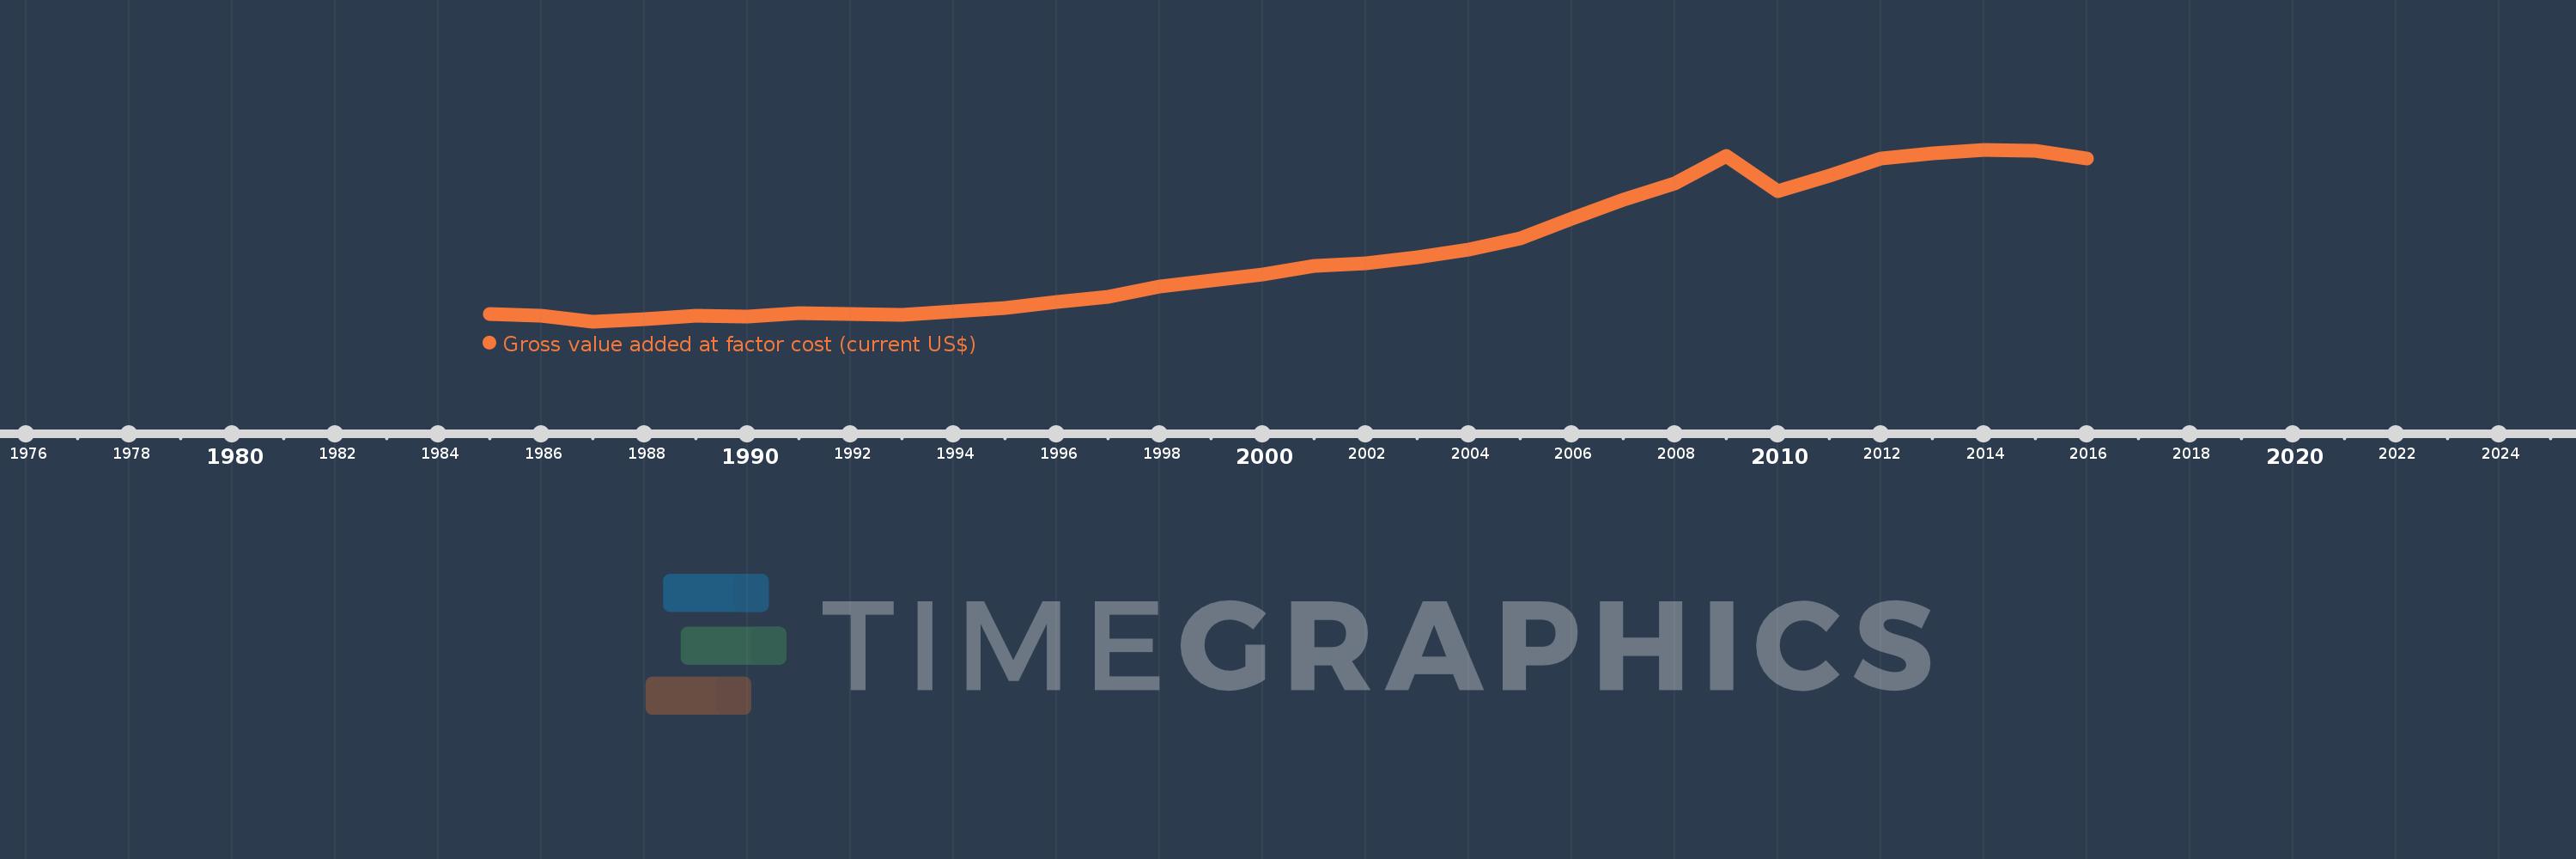
Gross value added at factor cost (current US$)
2016,2015,2014,2013,2012,2011,2010,2009,2008,2007,2006,2005,2004,2003,2002,2001,2000,1999,1998,1997,1996,1995,1994,1993,1992,1991,1990,1989,1988,1987,1986,1985
This statistics in other country:
AfghanistanAlbaniaAlgeriaAndorraAntigua and BarbudaArgentinaArmeniaArubaAustraliaAustriaAzerbaijanBahamas, TheBahrainBangladeshBarbadosBelarusBelgiumBelizeBeninBermudaBhutanBoliviaBosnia and HerzegovinaBotswanaBrazilBulgariaBurkina FasoBurundiCabo VerdeCambodiaCameroonCanadaCaribbean small statesCayman IslandsCentral African RepublicCentral Europe and the BalticsChadChileColombiaCongo, Dem. Rep.Costa RicaCroatiaCubaCyprusCzech RepublicDenmarkDjiboutiDominicaDominican RepublicEarly-demographic dividendEcuadorEgypt, Arab Rep.El SalvadorEquatorial GuineaEritreaEstoniaEthiopiaEuro areaEurope & Central AsiaEurope & Central Asia (excluding high income)Europe & Central Asia (IDA & IBRD countries)European UnionFaroe IslandsFijiFinlandFranceGabonGambia, TheGeorgiaGermanyGhanaGreeceGrenadaGuatemalaGuineaGuinea-BissauGuyanaHeavily indebted poor countries (HIPC)High incomeHondurasHong Kong SAR, ChinaHungaryIcelandIDA blendIDA onlyIDA totalIndiaIndonesiaIran, Islamic Rep.IrelandItalyJamaicaJapanJordanKazakhstanKenyaKiribatiKorea, Rep.KosovoKuwaitKyrgyz RepublicLao PDRLatin America & Caribbean Latin America & Caribbean (excluding high income)Latin America & the Caribbean (IDA & IBRD countries)LatviaLeast developed countries: UN classificationLebanonLesothoLiberiaLibyaLiechtensteinLithuaniaLow incomeLower middle incomeLuxembourgMacao SAR, ChinaMacedonia, FYRMadagascarMalawiMalaysiaMaldivesMaliMaltaMarshall IslandsMauritaniaMauritiusMexicoMicronesia, Fed. Sts.Middle East & North Africa (excluding high income)Middle East & North Africa (IDA & IBRD countries)MoldovaMongoliaMontenegroMoroccoMozambiqueNamibiaNepalNetherlandsNew ZealandNicaraguaNigeriaNorth AmericaNorwayOECD membersOmanPacific island small statesPakistanPalauPanamaPapua New GuineaParaguayPeruPolandPortugalPost-demographic dividendPre-demographic dividendRomaniaRussian FederationRwandaSao Tome and PrincipeSenegalSerbiaSeychellesSierra LeoneSingaporeSlovak RepublicSloveniaSolomon IslandsSouth AfricaSouth AsiaSouth Asia (IDA & IBRD)SpainSri LankaSt. Kitts and NevisSt. LuciaSt. Vincent and the GrenadinesSub-Saharan Africa Sub-Saharan Africa (excluding high income)Sub-Saharan Africa (IDA & IBRD countries)SudanSurinameSwazilandSwedenSwitzerlandSyrian Arab RepublicTajikistanTanzaniaThailandTimor-LesteTongaTrinidad and TobagoTunisiaTurkeyTurkmenistanTuvaluUgandaUkraineUnited KingdomUnited StatesUruguayUzbekistanVanuatuVenezuela, RBVietnamWest Bank and GazaWorldYemen, Rep.ZambiaZimbabwe Timeline:
This timeline shows a graph from 1985 to 2016 of Caribbean small states. No data until 1984. Number of actual observations by date: 32.
Source name:
World Development Indicators
Source organization:
World Bank national accounts data, and OECD National Accounts data files.
Categories, topics:
Economy & Growth
Last updated:
apr 23, 2017
Indicators value changes by year
Minimum:
13.277 bln
jan 1, 1987
Maximum:
62.462 bln
jan 1, 2014
At the date of observation
Value
Absolute change
Change from previous value
jan 1, 1985
15.53 bln
+15.53 bln
0.0%
jan 1, 1986
15.18 bln
-350.125 mln
-2.25%
jan 1, 1987
13.277 bln
-1.904 bln
-12.54%
jan 1, 1988
14.184 bln
+907.502 mln
6.84%
jan 1, 1989
15.001 bln
+816.559 mln
5.76%
jan 1, 1990
14.895 bln
-105.778 mln
-0.71%
jan 1, 1991
15.879 bln
+983.905 mln
6.61%
jan 1, 1992
15.671 bln
-208.281 mln
-1.31%
jan 1, 1993
15.311 bln
-359.271 mln
-2.29%
jan 1, 1994
16.302 bln
+990.438 mln
6.47%
jan 1, 1995
17.238 bln
+935.899 mln
5.74%
jan 1, 1996
18.888 bln
+1.65 bln
9.57%
jan 1, 1997
20.599 bln
+1.71 bln
9.06%
jan 1, 1998
23.311 bln
+2.712 bln
13.17%
jan 1, 1999
25.215 bln
+1.905 bln
8.17%
jan 1, 2000
26.783 bln
+1.568 bln
6.22%
jan 1, 2001
29.233 bln
+2.45 bln
9.15%
jan 1, 2002
30.065 bln
+831.413 mln
2.84%
jan 1, 2003
31.729 bln
+1.664 bln
5.53%
jan 1, 2004
34.081 bln
+2.352 bln
7.41%
jan 1, 2005
37.165 bln
+3.084 bln
9.05%
jan 1, 2006
42.87 bln
+5.705 bln
15.35%
jan 1, 2007
48.282 bln
+5.412 bln
12.63%
jan 1, 2008
53.027 bln
+4.744 bln
9.83%
jan 1, 2009
60.936 bln
+7.91 bln
14.92%
jan 1, 2010
50.772 bln
-10.165 bln
-16.68%
jan 1, 2011
55.167 bln
+4.395 bln
8.66%
jan 1, 2012
60.037 bln
+4.87 bln
8.83%
jan 1, 2013
61.637 bln
+1.6 bln
2.67%
jan 1, 2014
62.462 bln
+824.493 mln
1.34%
jan 1, 2015
62.376 bln
-86.052 mln
-0.14%
jan 1, 2016
60.05 bln
-2.326 bln
-3.73%
Ranking of countries by current statistics by years


Comments: