29
/
en
AIzaSyAYiBZKx7MnpbEhh9jyipgxe19OcubqV5w
April 1, 2024
49056
Middle East & North Africa (excluding high income)
MNA
false
2
1
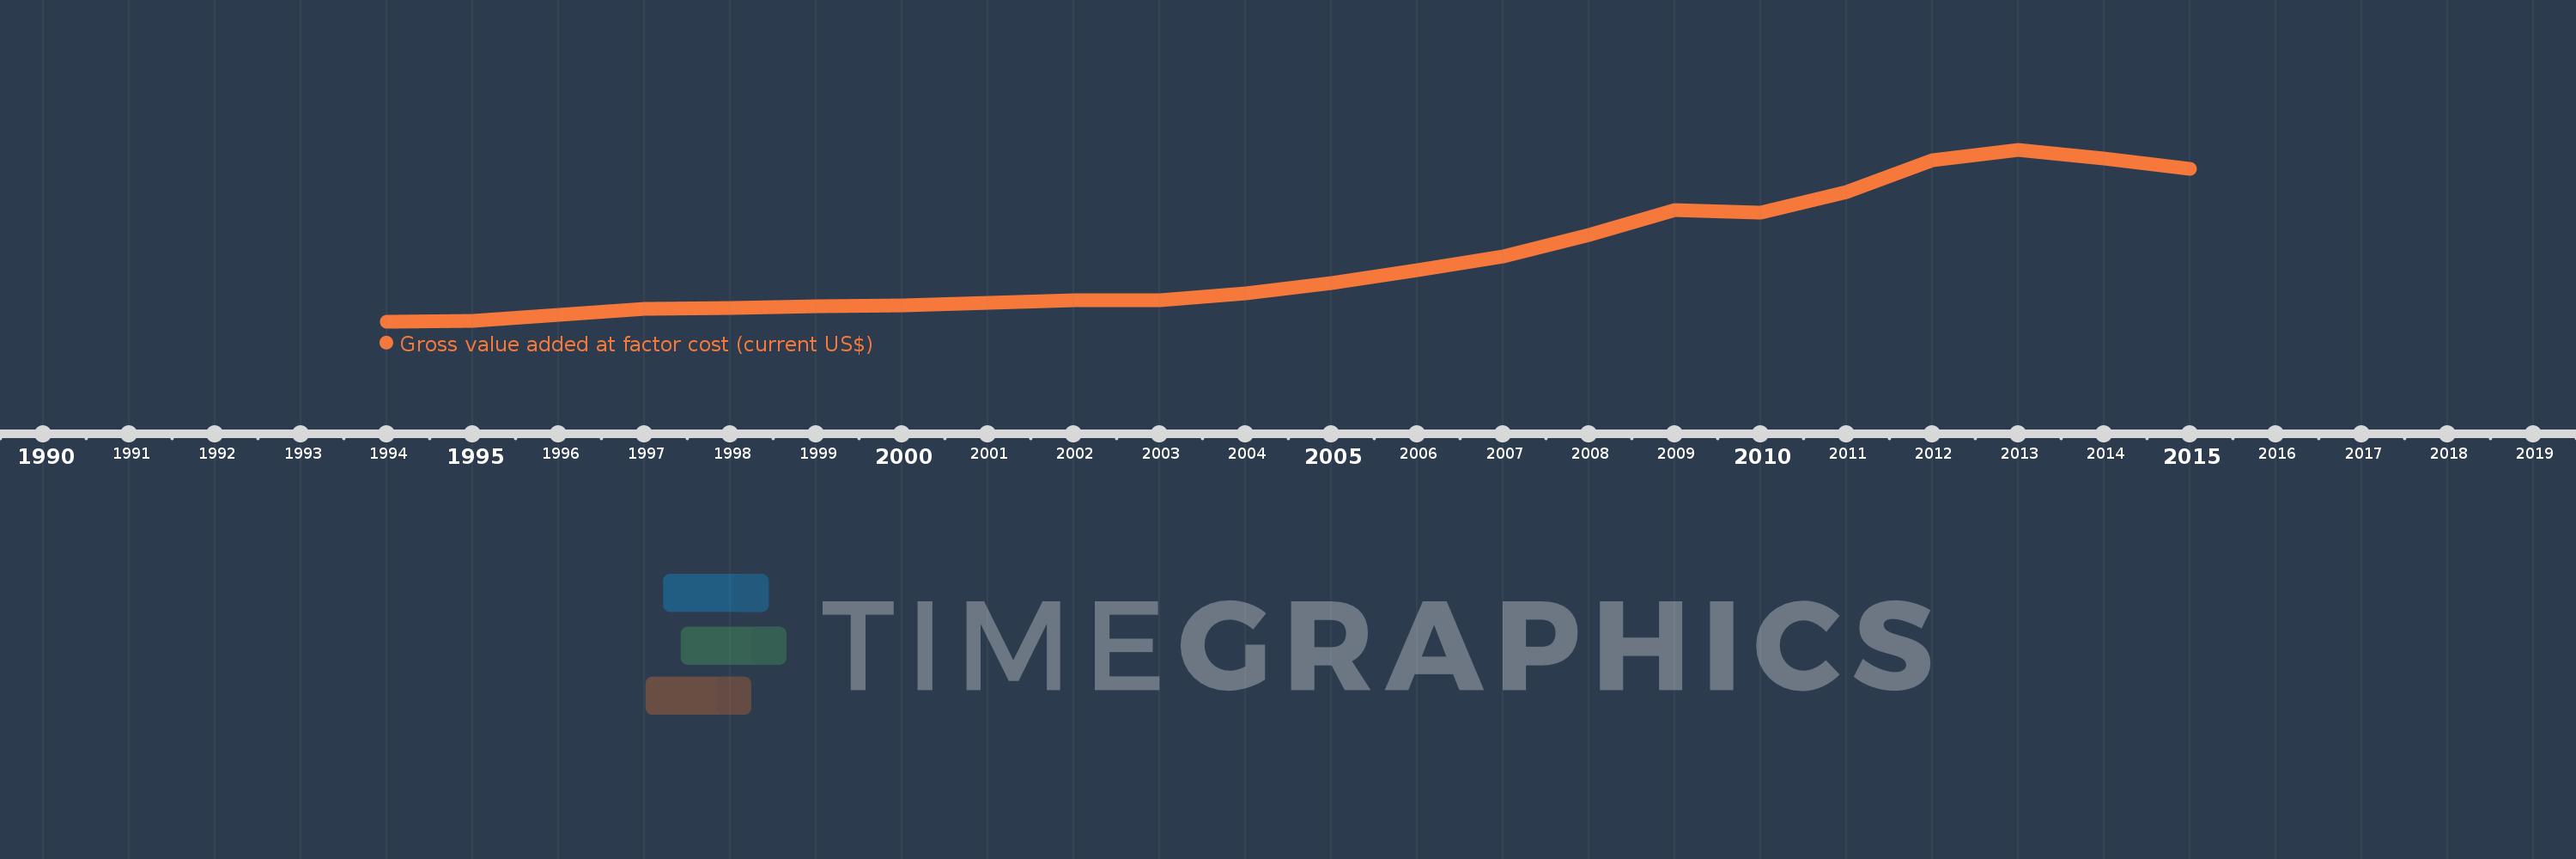
Gross value added at factor cost (current US$)
2015,2014,2013,2012,2011,2010,2009,2008,2007,2006,2005,2004,2003,2002,2001,2000,1999,1998,1997,1996,1995,1994
This statistics in other country:
AfghanistanAlbaniaAlgeriaAndorraAntigua and BarbudaArgentinaArmeniaArubaAustraliaAustriaAzerbaijanBahamas, TheBahrainBangladeshBarbadosBelarusBelgiumBelizeBeninBermudaBhutanBoliviaBosnia and HerzegovinaBotswanaBrazilBulgariaBurkina FasoBurundiCabo VerdeCambodiaCameroonCanadaCaribbean small statesCayman IslandsCentral African RepublicCentral Europe and the BalticsChadChileColombiaCongo, Dem. Rep.Costa RicaCroatiaCubaCyprusCzech RepublicDenmarkDjiboutiDominicaDominican RepublicEarly-demographic dividendEcuadorEgypt, Arab Rep.El SalvadorEquatorial GuineaEritreaEstoniaEthiopiaEuro areaEurope & Central AsiaEurope & Central Asia (excluding high income)Europe & Central Asia (IDA & IBRD countries)European UnionFaroe IslandsFijiFinlandFranceGabonGambia, TheGeorgiaGermanyGhanaGreeceGrenadaGuatemalaGuineaGuinea-BissauGuyanaHeavily indebted poor countries (HIPC)High incomeHondurasHong Kong SAR, ChinaHungaryIcelandIDA blendIDA onlyIDA totalIndiaIndonesiaIran, Islamic Rep.IrelandItalyJamaicaJapanJordanKazakhstanKenyaKiribatiKorea, Rep.KosovoKuwaitKyrgyz RepublicLao PDRLatin America & Caribbean Latin America & Caribbean (excluding high income)Latin America & the Caribbean (IDA & IBRD countries)LatviaLeast developed countries: UN classificationLebanonLesothoLiberiaLibyaLiechtensteinLithuaniaLow incomeLower middle incomeLuxembourgMacao SAR, ChinaMacedonia, FYRMadagascarMalawiMalaysiaMaldivesMaliMaltaMarshall IslandsMauritaniaMauritiusMexicoMicronesia, Fed. Sts.Middle East & North Africa (excluding high income)Middle East & North Africa (IDA & IBRD countries)MoldovaMongoliaMontenegroMoroccoMozambiqueNamibiaNepalNetherlandsNew ZealandNicaraguaNigeriaNorth AmericaNorwayOECD membersOmanPacific island small statesPakistanPalauPanamaPapua New GuineaParaguayPeruPolandPortugalPost-demographic dividendPre-demographic dividendRomaniaRussian FederationRwandaSao Tome and PrincipeSenegalSerbiaSeychellesSierra LeoneSingaporeSlovak RepublicSloveniaSolomon IslandsSouth AfricaSouth AsiaSouth Asia (IDA & IBRD)SpainSri LankaSt. Kitts and NevisSt. LuciaSt. Vincent and the GrenadinesSub-Saharan Africa Sub-Saharan Africa (excluding high income)Sub-Saharan Africa (IDA & IBRD countries)SudanSurinameSwazilandSwedenSwitzerlandSyrian Arab RepublicTajikistanTanzaniaThailandTimor-LesteTongaTrinidad and TobagoTunisiaTurkeyTurkmenistanTuvaluUgandaUkraineUnited KingdomUnited StatesUruguayUzbekistanVanuatuVenezuela, RBVietnamWest Bank and GazaWorldYemen, Rep.ZambiaZimbabwe Timeline:
This timeline shows a graph from 1994 to 2015 of Middle East & North Africa (excluding high income). No data until 1993. Number of actual observations by date: 22.
Source name:
World Development Indicators
Source organization:
World Bank national accounts data, and OECD National Accounts data files.
Categories, topics:
Economy & Growth
Last updated:
apr 23, 2017
Indicators value changes by year
Minimum:
262.341 bln
jan 1, 1994
Maximum:
1.647 trl
jan 1, 2013
At the date of observation
Value
Absolute change
Change from previous value
jan 1, 1994
262.341 bln
+262.341 bln
0.0%
jan 1, 1995
270.647 bln
+8.305 bln
3.17%
jan 1, 1996
317.437 bln
+46.79 bln
17.29%
jan 1, 1997
371.054 bln
+53.617 bln
16.89%
jan 1, 1998
377.521 bln
+6.467 bln
1.74%
jan 1, 1999
386.72 bln
+9.199 bln
2.44%
jan 1, 2000
399.376 bln
+12.656 bln
3.27%
jan 1, 2001
417.383 bln
+18.008 bln
4.51%
jan 1, 2002
437.65 bln
+20.266 bln
4.86%
jan 1, 2003
438.448 bln
+798.726 mln
0.18%
jan 1, 2004
494.168 bln
+55.719 bln
12.71%
jan 1, 2005
577.347 bln
+83.179 bln
16.83%
jan 1, 2006
681.794 bln
+104.447 bln
18.09%
jan 1, 2007
792.716 bln
+110.922 bln
16.27%
jan 1, 2008
963.783 bln
+171.067 bln
21.58%
jan 1, 2009
1.164 trl
+200.654 bln
20.82%
jan 1, 2010
1.145 trl
-19.633 bln
-1.69%
jan 1, 2011
1.311 trl
+166.05 bln
14.5%
jan 1, 2012
1.569 trl
+258.032 bln
19.68%
jan 1, 2013
1.647 trl
+78.094 bln
4.98%
jan 1, 2014
1.581 trl
-65.695 bln
-3.99%
jan 1, 2015
1.497 trl
-84.375 bln
-5.34%
Ranking of countries by current statistics by years


Comments: