29
/
en
AIzaSyAYiBZKx7MnpbEhh9jyipgxe19OcubqV5w
April 1, 2024
243668
Solomon Islands
SLB
true
2
1
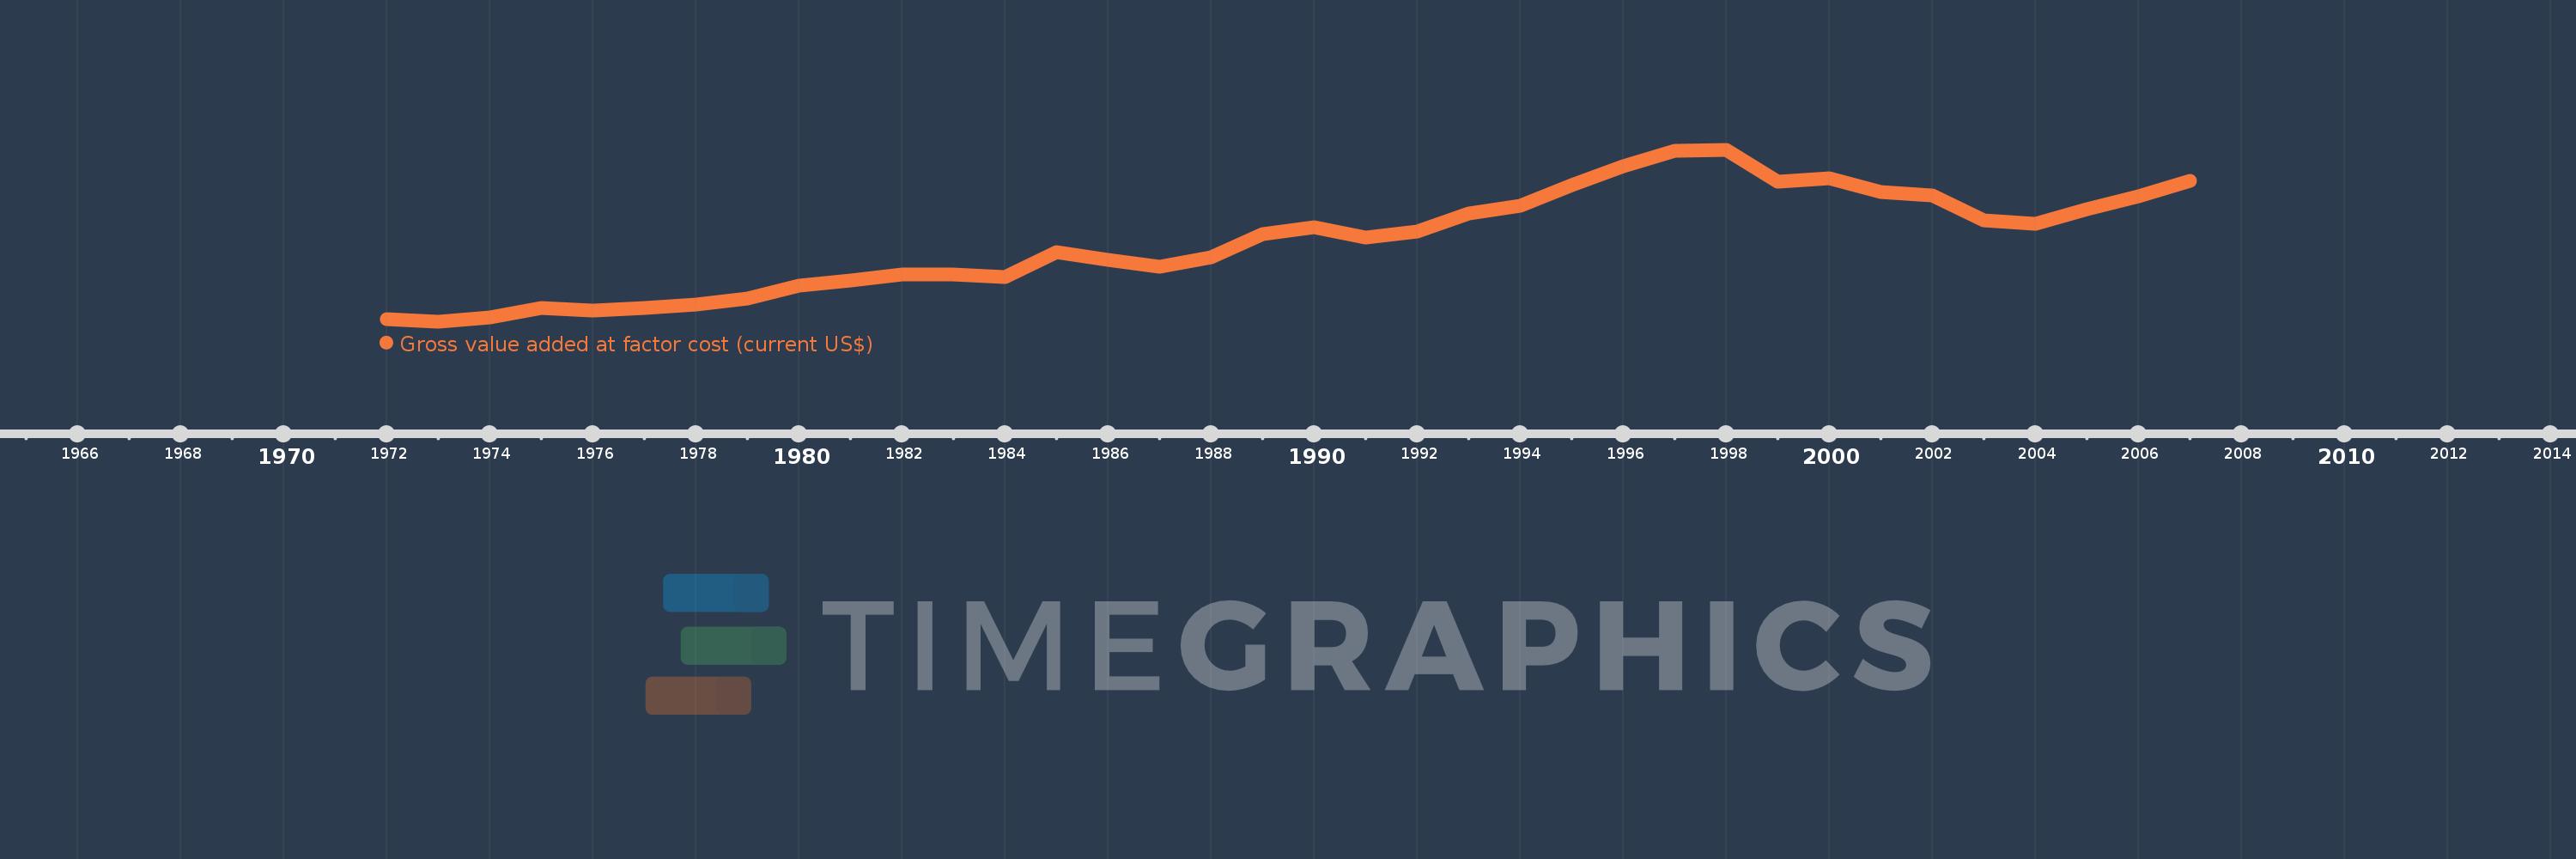
Gross value added at factor cost (current US$)
2007,2006,2005,2004,2003,2002,2001,2000,1999,1998,1997,1996,1995,1994,1993,1992,1991,1990,1989,1988,1987,1986,1985,1984,1983,1982,1981,1980,1979,1978,1977,1976,1975,1974,1973,1972
This statistics in other country:
AfghanistanAlbaniaAlgeriaAndorraAntigua and BarbudaArgentinaArmeniaArubaAustraliaAustriaAzerbaijanBahamas, TheBahrainBangladeshBarbadosBelarusBelgiumBelizeBeninBermudaBhutanBoliviaBosnia and HerzegovinaBotswanaBrazilBulgariaBurkina FasoBurundiCabo VerdeCambodiaCameroonCanadaCaribbean small statesCayman IslandsCentral African RepublicCentral Europe and the BalticsChadChileColombiaCongo, Dem. Rep.Costa RicaCroatiaCubaCyprusCzech RepublicDenmarkDjiboutiDominicaDominican RepublicEarly-demographic dividendEcuadorEgypt, Arab Rep.El SalvadorEquatorial GuineaEritreaEstoniaEthiopiaEuro areaEurope & Central AsiaEurope & Central Asia (excluding high income)Europe & Central Asia (IDA & IBRD countries)European UnionFaroe IslandsFijiFinlandFranceGabonGambia, TheGeorgiaGermanyGhanaGreeceGrenadaGuatemalaGuineaGuinea-BissauGuyanaHeavily indebted poor countries (HIPC)High incomeHondurasHong Kong SAR, ChinaHungaryIcelandIDA blendIDA onlyIDA totalIndiaIndonesiaIran, Islamic Rep.IrelandItalyJamaicaJapanJordanKazakhstanKenyaKiribatiKorea, Rep.KosovoKuwaitKyrgyz RepublicLao PDRLatin America & Caribbean Latin America & Caribbean (excluding high income)Latin America & the Caribbean (IDA & IBRD countries)LatviaLeast developed countries: UN classificationLebanonLesothoLiberiaLibyaLiechtensteinLithuaniaLow incomeLower middle incomeLuxembourgMacao SAR, ChinaMacedonia, FYRMadagascarMalawiMalaysiaMaldivesMaliMaltaMarshall IslandsMauritaniaMauritiusMexicoMicronesia, Fed. Sts.Middle East & North Africa (excluding high income)Middle East & North Africa (IDA & IBRD countries)MoldovaMongoliaMontenegroMoroccoMozambiqueNamibiaNepalNetherlandsNew ZealandNicaraguaNigeriaNorth AmericaNorwayOECD membersOmanPacific island small statesPakistanPalauPanamaPapua New GuineaParaguayPeruPolandPortugalPost-demographic dividendPre-demographic dividendRomaniaRussian FederationRwandaSao Tome and PrincipeSenegalSerbiaSeychellesSierra LeoneSingaporeSlovak RepublicSloveniaSolomon IslandsSouth AfricaSouth AsiaSouth Asia (IDA & IBRD)SpainSri LankaSt. Kitts and NevisSt. LuciaSt. Vincent and the GrenadinesSub-Saharan Africa Sub-Saharan Africa (excluding high income)Sub-Saharan Africa (IDA & IBRD countries)SudanSurinameSwazilandSwedenSwitzerlandSyrian Arab RepublicTajikistanTanzaniaThailandTimor-LesteTongaTrinidad and TobagoTunisiaTurkeyTurkmenistanTuvaluUgandaUkraineUnited KingdomUnited StatesUruguayUzbekistanVanuatuVenezuela, RBVietnamWest Bank and GazaWorldYemen, Rep.ZambiaZimbabwe Timeline:
This timeline shows a graph from 1972 to 2007 of Solomon Islands. No data until 1971. Number of actual observations by date: 36.
Source name:
World Development Indicators
Source organization:
World Bank national accounts data, and OECD National Accounts data files.
Categories, topics:
Economy & Growth
Last updated:
apr 23, 2017
Indicators value changes by year
Minimum:
39.054 mln
jan 1, 1973
Maximum:
539.267 mln
jan 1, 1998
At the date of observation
Value
Absolute change
Change from previous value
jan 1, 1972
48.464 mln
+48.464 mln
0.0%
jan 1, 1973
39.054 mln
-9.41 mln
-19.42%
jan 1, 1974
53.146 mln
+14.092 mln
36.08%
jan 1, 1975
80.814 mln
+27.668 mln
52.06%
jan 1, 1976
71.868 mln
-8.946 mln
-11.07%
jan 1, 1977
80.044 mln
+8.176 mln
11.38%
jan 1, 1978
89.377 mln
+9.333 mln
11.66%
jan 1, 1979
106.558 mln
+17.182 mln
19.22%
jan 1, 1980
143.649 mln
+37.091 mln
34.81%
jan 1, 1981
160.521 mln
+16.872 mln
11.75%
jan 1, 1982
176.971 mln
+16.45 mln
10.25%
jan 1, 1983
176.81 mln
-161.008K
-0.09%
jan 1, 1984
170.381 mln
-6.428 mln
-3.64%
jan 1, 1985
241.187 mln
+70.806 mln
41.56%
jan 1, 1986
220.962 mln
-20.225 mln
-8.39%
jan 1, 1987
199.426 mln
-21.536 mln
-9.75%
jan 1, 1988
227.025 mln
+27.6 mln
13.84%
jan 1, 1989
294.118 mln
+67.092 mln
29.55%
jan 1, 1990
315.89 mln
+21.773 mln
7.4%
jan 1, 1991
285.867 mln
-30.024 mln
-9.5%
jan 1, 1992
302.895 mln
+17.028 mln
5.96%
jan 1, 1993
354.872 mln
+51.977 mln
17.16%
jan 1, 1994
377.482 mln
+22.61 mln
6.37%
jan 1, 1995
437.261 mln
+59.779 mln
15.84%
jan 1, 1996
491.735 mln
+54.474 mln
12.46%
jan 1, 1997
537.068 mln
+45.333 mln
9.22%
jan 1, 1998
539.267 mln
+2.198 mln
0.41%
jan 1, 1999
447.753 mln
-91.513 mln
-16.97%
jan 1, 2000
456.398 mln
+8.645 mln
1.93%
jan 1, 2001
416.554 mln
-39.844 mln
-8.73%
jan 1, 2002
407.583 mln
-8.971 mln
-2.15%
jan 1, 2003
335.683 mln
-71.9 mln
-17.64%
jan 1, 2004
325.304 mln
-10.379 mln
-3.09%
jan 1, 2005
366.949 mln
+41.644 mln
12.8%
jan 1, 2006
405.902 mln
+38.953 mln
10.62%
jan 1, 2007
448.755 mln
+42.853 mln
10.56%
Ranking of countries by current statistics by years


Comments: