29
/
en
AIzaSyAYiBZKx7MnpbEhh9jyipgxe19OcubqV5w
April 1, 2024
275767
United Kingdom
GBR
true
2
1
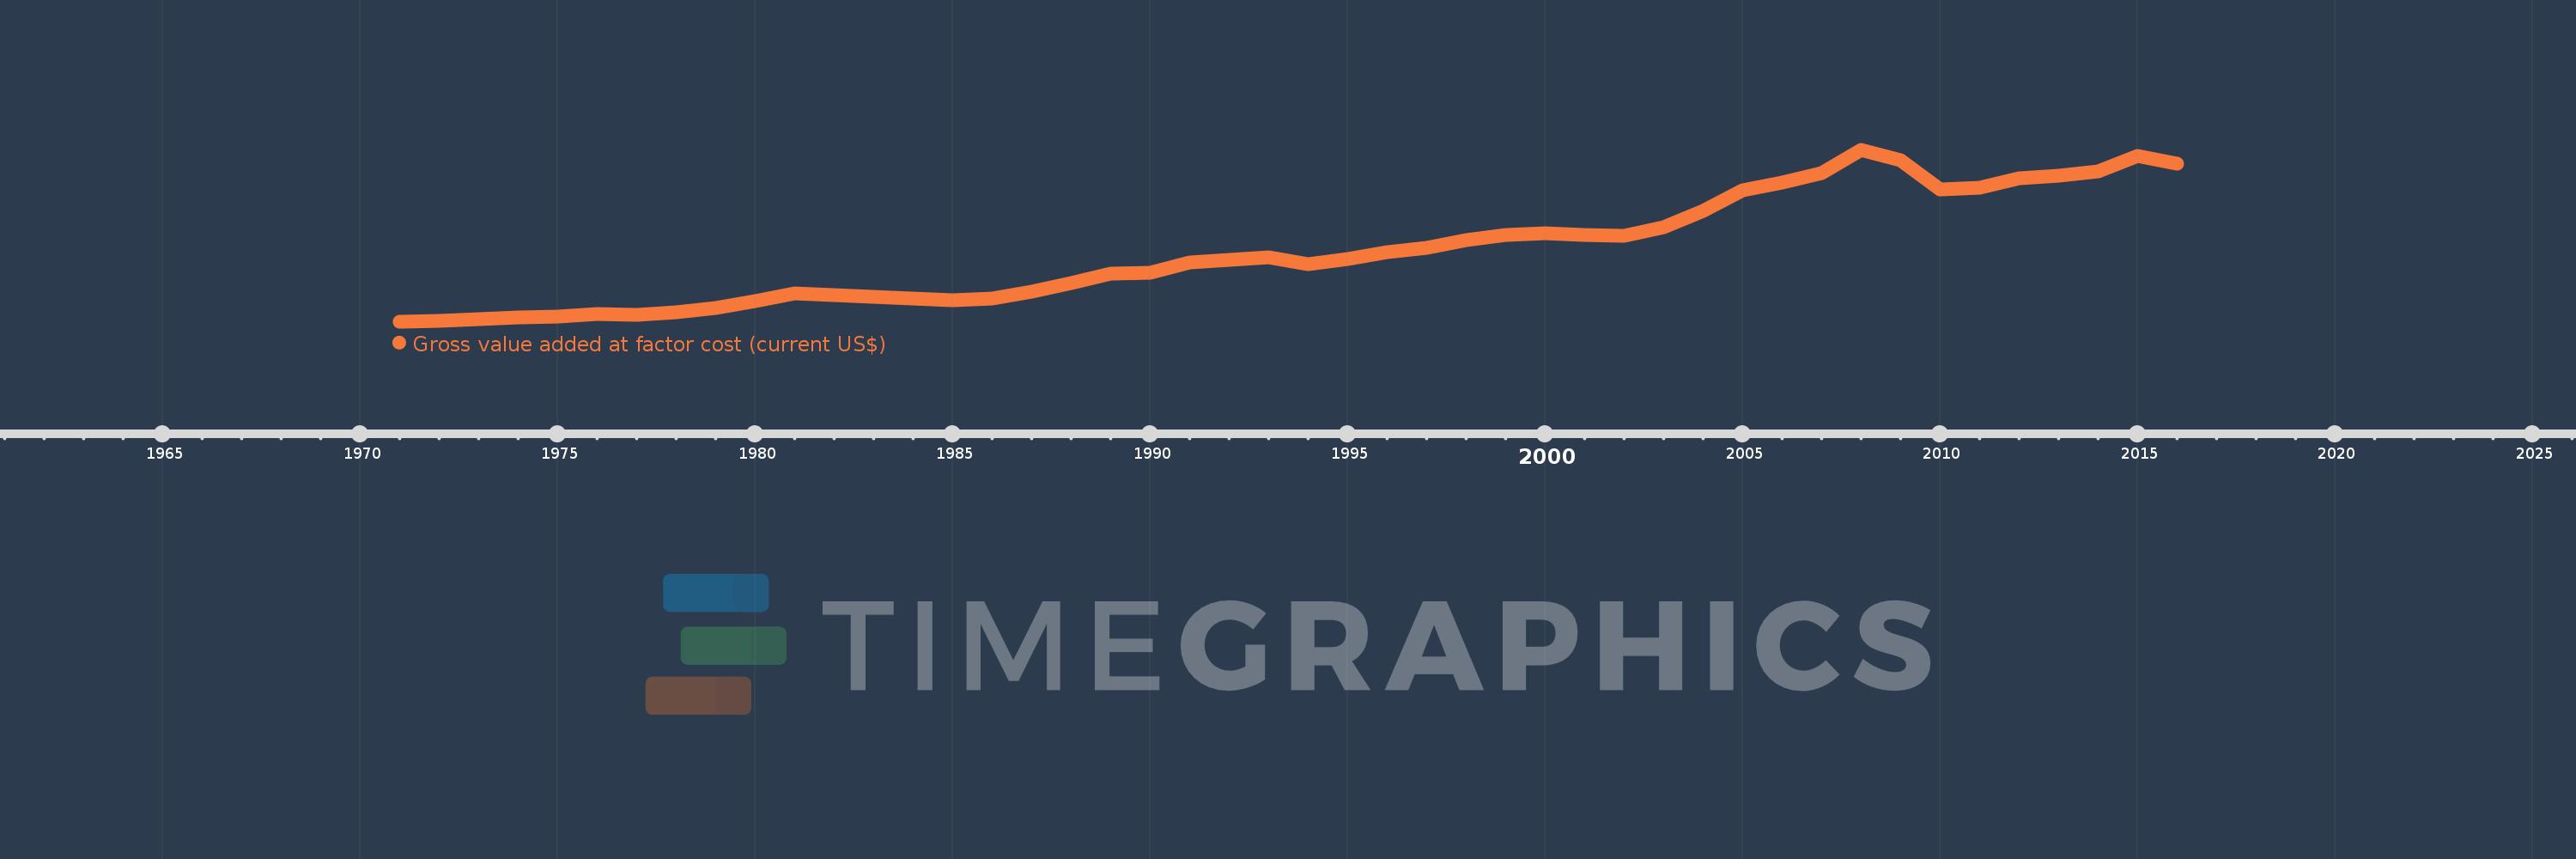
Gross value added at factor cost (current US$)
2016,2015,2014,2013,2012,2011,2010,2009,2008,2007,2006,2005,2004,2003,2002,2001,2000,1999,1998,1997,1996,1995,1994,1993,1992,1991,1990,1989,1988,1987,1986,1985,1984,1983,1982,1981,1980,1979,1978,1977,1976,1975,1974,1973,1972,1971
This statistics in other country:
AfghanistanAlbaniaAlgeriaAndorraAntigua and BarbudaArgentinaArmeniaArubaAustraliaAustriaAzerbaijanBahamas, TheBahrainBangladeshBarbadosBelarusBelgiumBelizeBeninBermudaBhutanBoliviaBosnia and HerzegovinaBotswanaBrazilBulgariaBurkina FasoBurundiCabo VerdeCambodiaCameroonCanadaCaribbean small statesCayman IslandsCentral African RepublicCentral Europe and the BalticsChadChileColombiaCongo, Dem. Rep.Costa RicaCroatiaCubaCyprusCzech RepublicDenmarkDjiboutiDominicaDominican RepublicEarly-demographic dividendEcuadorEgypt, Arab Rep.El SalvadorEquatorial GuineaEritreaEstoniaEthiopiaEuro areaEurope & Central AsiaEurope & Central Asia (excluding high income)Europe & Central Asia (IDA & IBRD countries)European UnionFaroe IslandsFijiFinlandFranceGabonGambia, TheGeorgiaGermanyGhanaGreeceGrenadaGuatemalaGuineaGuinea-BissauGuyanaHeavily indebted poor countries (HIPC)High incomeHondurasHong Kong SAR, ChinaHungaryIcelandIDA blendIDA onlyIDA totalIndiaIndonesiaIran, Islamic Rep.IrelandItalyJamaicaJapanJordanKazakhstanKenyaKiribatiKorea, Rep.KosovoKuwaitKyrgyz RepublicLao PDRLatin America & Caribbean Latin America & Caribbean (excluding high income)Latin America & the Caribbean (IDA & IBRD countries)LatviaLeast developed countries: UN classificationLebanonLesothoLiberiaLibyaLiechtensteinLithuaniaLow incomeLower middle incomeLuxembourgMacao SAR, ChinaMacedonia, FYRMadagascarMalawiMalaysiaMaldivesMaliMaltaMarshall IslandsMauritaniaMauritiusMexicoMicronesia, Fed. Sts.Middle East & North Africa (excluding high income)Middle East & North Africa (IDA & IBRD countries)MoldovaMongoliaMontenegroMoroccoMozambiqueNamibiaNepalNetherlandsNew ZealandNicaraguaNigeriaNorth AmericaNorwayOECD membersOmanPacific island small statesPakistanPalauPanamaPapua New GuineaParaguayPeruPolandPortugalPost-demographic dividendPre-demographic dividendRomaniaRussian FederationRwandaSao Tome and PrincipeSenegalSerbiaSeychellesSierra LeoneSingaporeSlovak RepublicSloveniaSolomon IslandsSouth AfricaSouth AsiaSouth Asia (IDA & IBRD)SpainSri LankaSt. Kitts and NevisSt. LuciaSt. Vincent and the GrenadinesSub-Saharan Africa Sub-Saharan Africa (excluding high income)Sub-Saharan Africa (IDA & IBRD countries)SudanSurinameSwazilandSwedenSwitzerlandSyrian Arab RepublicTajikistanTanzaniaThailandTimor-LesteTongaTrinidad and TobagoTunisiaTurkeyTurkmenistanTuvaluUgandaUkraineUnited KingdomUnited StatesUruguayUzbekistanVanuatuVenezuela, RBVietnamWest Bank and GazaWorldYemen, Rep.ZambiaZimbabwe Timeline:
This timeline shows a graph from 1971 to 2016 of United Kingdom. No data until 1970. Number of actual observations by date: 46.
Source name:
World Development Indicators
Source organization:
World Bank national accounts data, and OECD National Accounts data files.
Categories, topics:
Economy & Growth
Last updated:
apr 23, 2017
Indicators value changes by year
Minimum:
128.869 bln
jan 1, 1971
Maximum:
2.757 trl
jan 1, 2008
At the date of observation
Value
Absolute change
Change from previous value
jan 1, 1971
128.869 bln
+128.869 bln
0.0%
jan 1, 1972
146.947 bln
+18.078 bln
14.03%
jan 1, 1973
170.618 bln
+23.671 bln
16.11%
jan 1, 1974
195.046 bln
+24.428 bln
14.32%
jan 1, 1975
213.709 bln
+18.663 bln
9.57%
jan 1, 1976
253.295 bln
+39.586 bln
18.52%
jan 1, 1977
243.035 bln
-10.26 bln
-4.05%
jan 1, 1978
272.6 bln
+29.565 bln
12.16%
jan 1, 1979
345.044 bln
+72.444 bln
26.58%
jan 1, 1980
444.637 bln
+99.594 bln
28.86%
jan 1, 1981
567.674 bln
+123.036 bln
27.67%
jan 1, 1982
540.742 bln
-26.932 bln
-4.74%
jan 1, 1983
510.504 bln
-30.238 bln
-5.59%
jan 1, 1984
484.858 bln
-25.646 bln
-5.02%
jan 1, 1985
455.081 bln
-29.776 bln
-6.14%
jan 1, 1986
481.264 bln
+26.183 bln
5.75%
jan 1, 1987
587.444 bln
+106.179 bln
22.06%
jan 1, 1988
720.483 bln
+133.039 bln
22.65%
jan 1, 1989
875.002 bln
+154.519 bln
21.45%
jan 1, 1990
886.061 bln
+11.06 bln
1.26%
jan 1, 1991
1.042 trl
+155.729 bln
17.58%
jan 1, 1992
1.083 trl
+41.339 bln
3.97%
jan 1, 1993
1.124 trl
+41.252 bln
3.81%
jan 1, 1994
1.015 trl
-109.398 bln
-9.73%
jan 1, 1995
1.097 trl
+81.979 bln
8.08%
jan 1, 1996
1.195 trl
+98.107 bln
8.94%
jan 1, 1997
1.263 trl
+67.933 bln
5.68%
jan 1, 1998
1.387 trl
+124.271 bln
9.84%
jan 1, 1999
1.461 trl
+73.703 bln
5.31%
jan 1, 2000
1.48 trl
+19.052 bln
1.3%
jan 1, 2001
1.465 trl
-14.835 bln
-1.0%
jan 1, 2002
1.449 trl
-16.552 bln
-1.13%
jan 1, 2003
1.58 trl
+131.627 bln
9.09%
jan 1, 2004
1.825 trl
+245.134 bln
15.51%
jan 1, 2005
2.147 trl
+321.747 bln
17.63%
jan 1, 2006
2.258 trl
+110.703 bln
5.16%
jan 1, 2007
2.412 trl
+153.903 bln
6.82%
jan 1, 2008
2.757 trl
+344.815 bln
14.3%
jan 1, 2009
2.599 trl
-157.109 bln
-5.7%
jan 1, 2010
2.153 trl
-446.121 bln
-17.16%
jan 1, 2011
2.186 trl
+32.437 bln
1.51%
jan 1, 2012
2.327 trl
+140.893 bln
6.45%
jan 1, 2013
2.363 trl
+35.834 bln
1.54%
jan 1, 2014
2.426 trl
+63.084 bln
2.67%
jan 1, 2015
2.673 trl
+247.107 bln
10.19%
jan 1, 2016
2.547 trl
-125.581 bln
-4.7%
Ranking of countries by current statistics by years


Comments: