29
/
en
AIzaSyAYiBZKx7MnpbEhh9jyipgxe19OcubqV5w
April 1, 2024
186592
Malawi
MWI
true
2
1
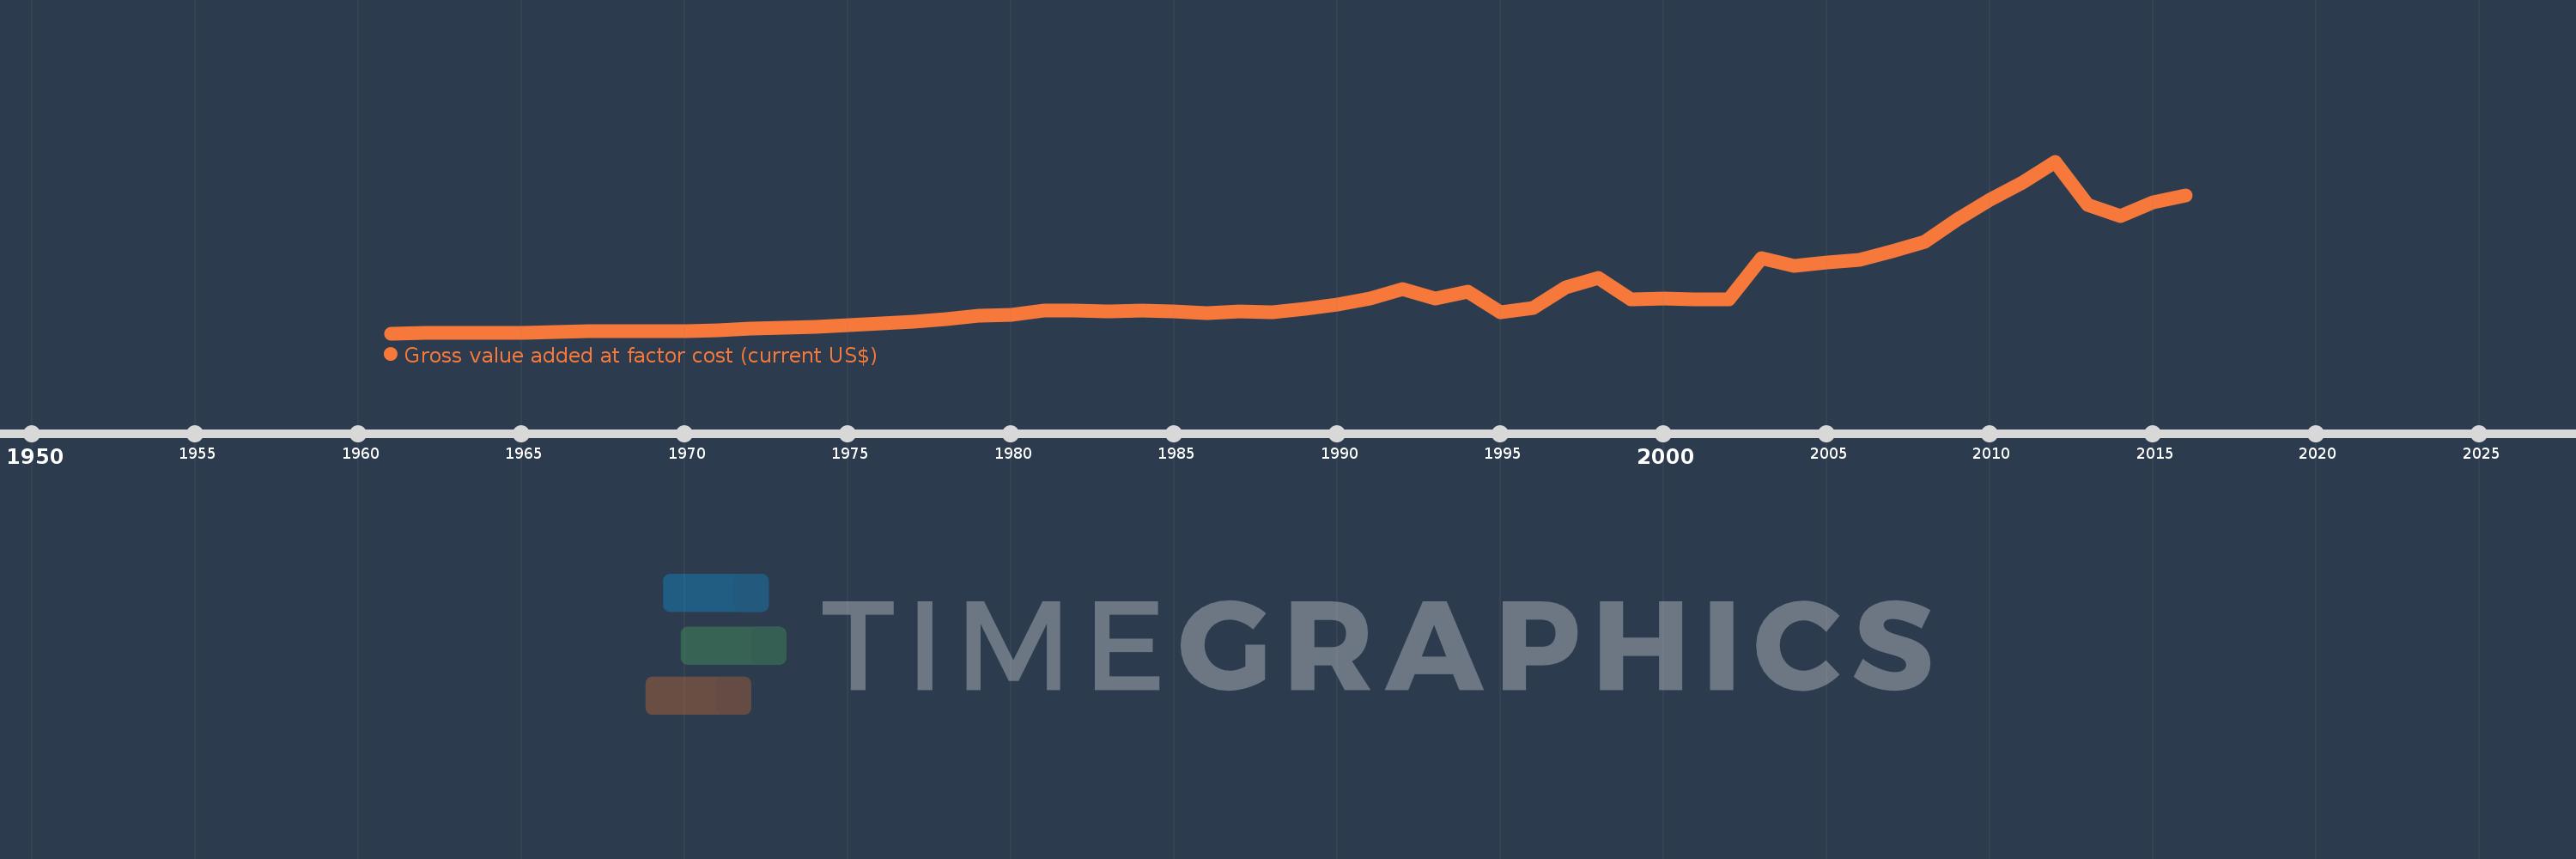
Gross value added at factor cost (current US$)
2016,2015,2014,2013,2012,2011,2010,2009,2008,2007,2006,2005,2004,2003,2002,2001,2000,1999,1998,1997,1996,1995,1994,1993,1992,1991,1990,1989,1988,1987,1986,1985,1984,1983,1982,1981,1980,1979,1978,1977,1976,1975,1974,1973,1972,1971,1970,1969,1968,1967,1966,1965,1964,1963,1962,1961
This statistics in other country:
AfghanistanAlbaniaAlgeriaAndorraAntigua and BarbudaArgentinaArmeniaArubaAustraliaAustriaAzerbaijanBahamas, TheBahrainBangladeshBarbadosBelarusBelgiumBelizeBeninBermudaBhutanBoliviaBosnia and HerzegovinaBotswanaBrazilBulgariaBurkina FasoBurundiCabo VerdeCambodiaCameroonCanadaCaribbean small statesCayman IslandsCentral African RepublicCentral Europe and the BalticsChadChileColombiaCongo, Dem. Rep.Costa RicaCroatiaCubaCyprusCzech RepublicDenmarkDjiboutiDominicaDominican RepublicEarly-demographic dividendEcuadorEgypt, Arab Rep.El SalvadorEquatorial GuineaEritreaEstoniaEthiopiaEuro areaEurope & Central AsiaEurope & Central Asia (excluding high income)Europe & Central Asia (IDA & IBRD countries)European UnionFaroe IslandsFijiFinlandFranceGabonGambia, TheGeorgiaGermanyGhanaGreeceGrenadaGuatemalaGuineaGuinea-BissauGuyanaHeavily indebted poor countries (HIPC)High incomeHondurasHong Kong SAR, ChinaHungaryIcelandIDA blendIDA onlyIDA totalIndiaIndonesiaIran, Islamic Rep.IrelandItalyJamaicaJapanJordanKazakhstanKenyaKiribatiKorea, Rep.KosovoKuwaitKyrgyz RepublicLao PDRLatin America & Caribbean Latin America & Caribbean (excluding high income)Latin America & the Caribbean (IDA & IBRD countries)LatviaLeast developed countries: UN classificationLebanonLesothoLiberiaLibyaLiechtensteinLithuaniaLow incomeLower middle incomeLuxembourgMacao SAR, ChinaMacedonia, FYRMadagascarMalawiMalaysiaMaldivesMaliMaltaMarshall IslandsMauritaniaMauritiusMexicoMicronesia, Fed. Sts.Middle East & North Africa (excluding high income)Middle East & North Africa (IDA & IBRD countries)MoldovaMongoliaMontenegroMoroccoMozambiqueNamibiaNepalNetherlandsNew ZealandNicaraguaNigeriaNorth AmericaNorwayOECD membersOmanPacific island small statesPakistanPalauPanamaPapua New GuineaParaguayPeruPolandPortugalPost-demographic dividendPre-demographic dividendRomaniaRussian FederationRwandaSao Tome and PrincipeSenegalSerbiaSeychellesSierra LeoneSingaporeSlovak RepublicSloveniaSolomon IslandsSouth AfricaSouth AsiaSouth Asia (IDA & IBRD)SpainSri LankaSt. Kitts and NevisSt. LuciaSt. Vincent and the GrenadinesSub-Saharan Africa Sub-Saharan Africa (excluding high income)Sub-Saharan Africa (IDA & IBRD countries)SudanSurinameSwazilandSwedenSwitzerlandSyrian Arab RepublicTajikistanTanzaniaThailandTimor-LesteTongaTrinidad and TobagoTunisiaTurkeyTurkmenistanTuvaluUgandaUkraineUnited KingdomUnited StatesUruguayUzbekistanVanuatuVenezuela, RBVietnamWest Bank and GazaWorldYemen, Rep.ZambiaZimbabwe Timeline:
This timeline shows a graph from 1961 to 2016 of Malawi. No data until 1960. Number of actual observations by date: 56.
Source name:
World Development Indicators
Source organization:
World Bank national accounts data, and OECD National Accounts data files.
Categories, topics:
Economy & Growth
Last updated:
apr 23, 2017
Indicators value changes by year
Minimum:
157.5 mln
jan 1, 1961
Maximum:
7.351 bln
jan 1, 2012
At the date of observation
Value
Absolute change
Change from previous value
jan 1, 1961
157.5 mln
+157.5 mln
0.0%
jan 1, 1962
168.7 mln
+11.2 mln
7.11%
jan 1, 1963
176.96 mln
+8.26 mln
4.9%
jan 1, 1964
184.38 mln
+7.42 mln
4.19%
jan 1, 1965
188.16 mln
+3.78 mln
2.05%
jan 1, 1966
220.36 mln
+32.2 mln
17.11%
jan 1, 1967
252.7 mln
+32.34 mln
14.68%
jan 1, 1968
255.728 mln
+3.028 mln
1.2%
jan 1, 1969
232.68 mln
-23.048 mln
-9.01%
jan 1, 1970
250.44 mln
+17.76 mln
7.63%
jan 1, 1971
270.72 mln
+20.28 mln
8.1%
jan 1, 1972
339.634 mln
+68.914 mln
25.46%
jan 1, 1973
378.388 mln
+38.754 mln
11.41%
jan 1, 1974
415.984 mln
+37.596 mln
9.94%
jan 1, 1975
515.095 mln
+99.111 mln
23.83%
jan 1, 1976
572.68 mln
+57.584 mln
11.18%
jan 1, 1977
633.398 mln
+60.719 mln
10.6%
jan 1, 1978
757.425 mln
+124.026 mln
19.58%
jan 1, 1979
880.005 mln
+122.58 mln
16.18%
jan 1, 1980
941.144 mln
+61.139 mln
6.95%
jan 1, 1981
1.11 bln
+169.07 mln
17.96%
jan 1, 1982
1.117 bln
+7.066 mln
0.64%
jan 1, 1983
1.07 bln
-47.181 mln
-4.22%
jan 1, 1984
1.104 bln
+34.293 mln
3.2%
jan 1, 1985
1.082 bln
-22.377 mln
-2.03%
jan 1, 1986
1.006 bln
-76.314 mln
-7.05%
jan 1, 1987
1.065 bln
+58.844 mln
5.85%
jan 1, 1988
1.039 bln
-25.223 mln
-2.37%
jan 1, 1989
1.198 bln
+158.7 mln
15.27%
jan 1, 1990
1.352 bln
+153.912 mln
12.85%
jan 1, 1991
1.608 bln
+256.452 mln
18.97%
jan 1, 1992
1.998 bln
+389.82 mln
24.24%
jan 1, 1993
1.619 bln
-378.736 mln
-18.95%
jan 1, 1994
1.896 bln
+276.673 mln
17.08%
jan 1, 1995
1.053 bln
-843.251 mln
-44.47%
jan 1, 1996
1.235 bln
+182.108 mln
17.3%
jan 1, 1997
2.066 bln
+830.876 mln
67.28%
jan 1, 1998
2.477 bln
+411.096 mln
19.9%
jan 1, 1999
1.584 bln
-893.239 mln
-36.06%
jan 1, 2000
1.614 bln
+30.699 mln
1.94%
jan 1, 2001
1.572 bln
-41.959 mln
-2.6%
jan 1, 2002
1.562 bln
-10.859 mln
-0.69%
jan 1, 2003
3.318 bln
+1.756 bln
112.44%
jan 1, 2004
2.988 bln
-329.964 mln
-9.95%
jan 1, 2005
3.12 bln
+132.64 mln
4.44%
jan 1, 2006
3.243 bln
+122.6 mln
3.93%
jan 1, 2007
3.586 bln
+343.62 mln
10.6%
jan 1, 2008
3.99 bln
+403.57 mln
11.25%
jan 1, 2009
4.933 bln
+942.739 mln
23.63%
jan 1, 2010
5.745 bln
+812.431 mln
16.47%
jan 1, 2011
6.454 bln
+709.205 mln
12.34%
jan 1, 2012
7.351 bln
+896.651 mln
13.89%
jan 1, 2013
5.533 bln
-1.818 bln
-24.73%
jan 1, 2014
5.062 bln
-470.577 mln
-8.5%
jan 1, 2015
5.64 bln
+577.88 mln
11.41%
jan 1, 2016
5.939 bln
+298.525 mln
5.29%
Ranking of countries by current statistics by years


Comments: