29
/
en
AIzaSyAYiBZKx7MnpbEhh9jyipgxe19OcubqV5w
April 1, 2024
235854
Senegal
SEN
true
2
1
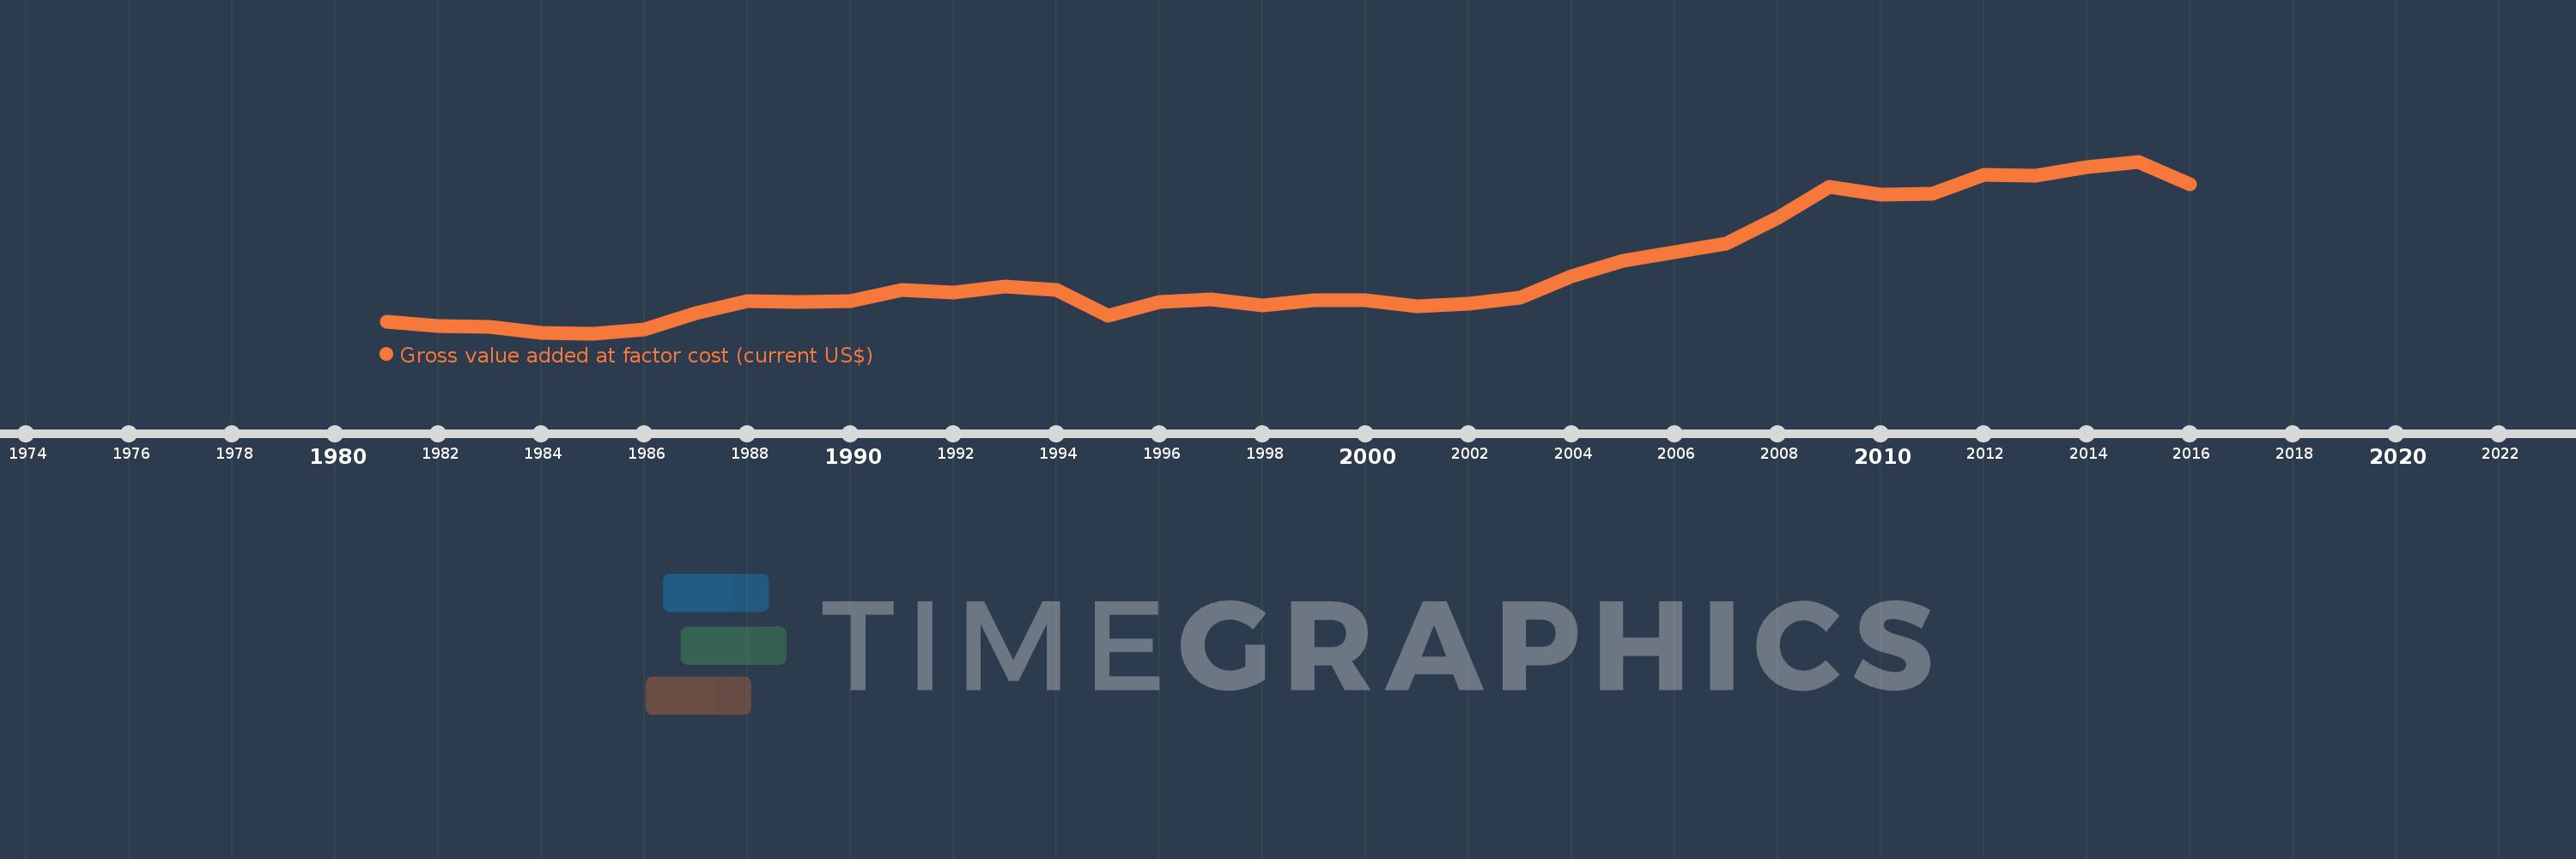
Gross value added at factor cost (current US$)
2016,2015,2014,2013,2012,2011,2010,2009,2008,2007,2006,2005,2004,2003,2002,2001,2000,1999,1998,1997,1996,1995,1994,1993,1992,1991,1990,1989,1988,1987,1986,1985,1984,1983,1982,1981
This statistics in other country:
AfghanistanAlbaniaAlgeriaAndorraAntigua and BarbudaArgentinaArmeniaArubaAustraliaAustriaAzerbaijanBahamas, TheBahrainBangladeshBarbadosBelarusBelgiumBelizeBeninBermudaBhutanBoliviaBosnia and HerzegovinaBotswanaBrazilBulgariaBurkina FasoBurundiCabo VerdeCambodiaCameroonCanadaCaribbean small statesCayman IslandsCentral African RepublicCentral Europe and the BalticsChadChileColombiaCongo, Dem. Rep.Costa RicaCroatiaCubaCyprusCzech RepublicDenmarkDjiboutiDominicaDominican RepublicEarly-demographic dividendEcuadorEgypt, Arab Rep.El SalvadorEquatorial GuineaEritreaEstoniaEthiopiaEuro areaEurope & Central AsiaEurope & Central Asia (excluding high income)Europe & Central Asia (IDA & IBRD countries)European UnionFaroe IslandsFijiFinlandFranceGabonGambia, TheGeorgiaGermanyGhanaGreeceGrenadaGuatemalaGuineaGuinea-BissauGuyanaHeavily indebted poor countries (HIPC)High incomeHondurasHong Kong SAR, ChinaHungaryIcelandIDA blendIDA onlyIDA totalIndiaIndonesiaIran, Islamic Rep.IrelandItalyJamaicaJapanJordanKazakhstanKenyaKiribatiKorea, Rep.KosovoKuwaitKyrgyz RepublicLao PDRLatin America & Caribbean Latin America & Caribbean (excluding high income)Latin America & the Caribbean (IDA & IBRD countries)LatviaLeast developed countries: UN classificationLebanonLesothoLiberiaLibyaLiechtensteinLithuaniaLow incomeLower middle incomeLuxembourgMacao SAR, ChinaMacedonia, FYRMadagascarMalawiMalaysiaMaldivesMaliMaltaMarshall IslandsMauritaniaMauritiusMexicoMicronesia, Fed. Sts.Middle East & North Africa (excluding high income)Middle East & North Africa (IDA & IBRD countries)MoldovaMongoliaMontenegroMoroccoMozambiqueNamibiaNepalNetherlandsNew ZealandNicaraguaNigeriaNorth AmericaNorwayOECD membersOmanPacific island small statesPakistanPalauPanamaPapua New GuineaParaguayPeruPolandPortugalPost-demographic dividendPre-demographic dividendRomaniaRussian FederationRwandaSao Tome and PrincipeSenegalSerbiaSeychellesSierra LeoneSingaporeSlovak RepublicSloveniaSolomon IslandsSouth AfricaSouth AsiaSouth Asia (IDA & IBRD)SpainSri LankaSt. Kitts and NevisSt. LuciaSt. Vincent and the GrenadinesSub-Saharan Africa Sub-Saharan Africa (excluding high income)Sub-Saharan Africa (IDA & IBRD countries)SudanSurinameSwazilandSwedenSwitzerlandSyrian Arab RepublicTajikistanTanzaniaThailandTimor-LesteTongaTrinidad and TobagoTunisiaTurkeyTurkmenistanTuvaluUgandaUkraineUnited KingdomUnited StatesUruguayUzbekistanVanuatuVenezuela, RBVietnamWest Bank and GazaWorldYemen, Rep.ZambiaZimbabwe Timeline:
This timeline shows a graph from 1981 to 2016 of Senegal. No data until 1980. Number of actual observations by date: 36.
Source name:
World Development Indicators
Source organization:
World Bank national accounts data, and OECD National Accounts data files.
Categories, topics:
Economy & Growth
Last updated:
apr 23, 2017
Indicators value changes by year
Minimum:
2.396 bln
jan 1, 1985
Maximum:
13.341 bln
jan 1, 2015
At the date of observation
Value
Absolute change
Change from previous value
jan 1, 1981
3.119 bln
+3.119 bln
0.0%
jan 1, 1982
2.849 bln
-270.104 mln
-8.66%
jan 1, 1983
2.78 bln
-68.641 mln
-2.41%
jan 1, 1984
2.45 bln
-329.927 mln
-11.87%
jan 1, 1985
2.396 bln
-54.215 mln
-2.21%
jan 1, 1986
2.631 bln
+235.659 mln
9.84%
jan 1, 1987
3.689 bln
+1.058 bln
40.19%
jan 1, 1988
4.427 bln
+738.333 mln
20.01%
jan 1, 1989
4.387 bln
-40.135 mln
-0.91%
jan 1, 1990
4.473 bln
+85.46 mln
1.95%
jan 1, 1991
5.137 bln
+664.623 mln
14.86%
jan 1, 1992
5.018 bln
-119.096 mln
-2.32%
jan 1, 1993
5.368 bln
+349.457 mln
6.96%
jan 1, 1994
5.146 bln
-221.179 mln
-4.12%
jan 1, 1995
3.53 bln
-1.617 bln
-31.42%
jan 1, 1996
4.398 bln
+868.238 mln
24.6%
jan 1, 1997
4.531 bln
+132.582 mln
3.01%
jan 1, 1998
4.17 bln
-360.437 mln
-7.96%
jan 1, 1999
4.493 bln
+322.733 mln
7.74%
jan 1, 2000
4.527 bln
+34.113 mln
0.76%
jan 1, 2001
4.122 bln
-405.078 mln
-8.95%
jan 1, 2002
4.306 bln
+184.528 mln
4.48%
jan 1, 2003
4.678 bln
+372.017 mln
8.64%
jan 1, 2004
6.022 bln
+1.344 bln
28.73%
jan 1, 2005
7.032 bln
+1.01 bln
16.77%
jan 1, 2006
7.568 bln
+536.059 mln
7.62%
jan 1, 2007
8.094 bln
+525.25 mln
6.94%
jan 1, 2008
9.735 bln
+1.641 bln
20.28%
jan 1, 2009
11.735 bln
+2.0 bln
20.54%
jan 1, 2010
11.233 bln
-501.308 mln
-4.27%
jan 1, 2011
11.306 bln
+72.624 mln
0.65%
jan 1, 2012
12.495 bln
+1.189 bln
10.52%
jan 1, 2013
12.458 bln
-36.917 mln
-0.3%
jan 1, 2014
12.993 bln
+534.835 mln
4.29%
jan 1, 2015
13.341 bln
+347.353 mln
2.67%
jan 1, 2016
11.87 bln
-1.471 bln
-11.03%
Ranking of countries by current statistics by years


Comments: