29
/
en
AIzaSyAYiBZKx7MnpbEhh9jyipgxe19OcubqV5w
April 1, 2024
79532
Barbados
BRB
true
2
1
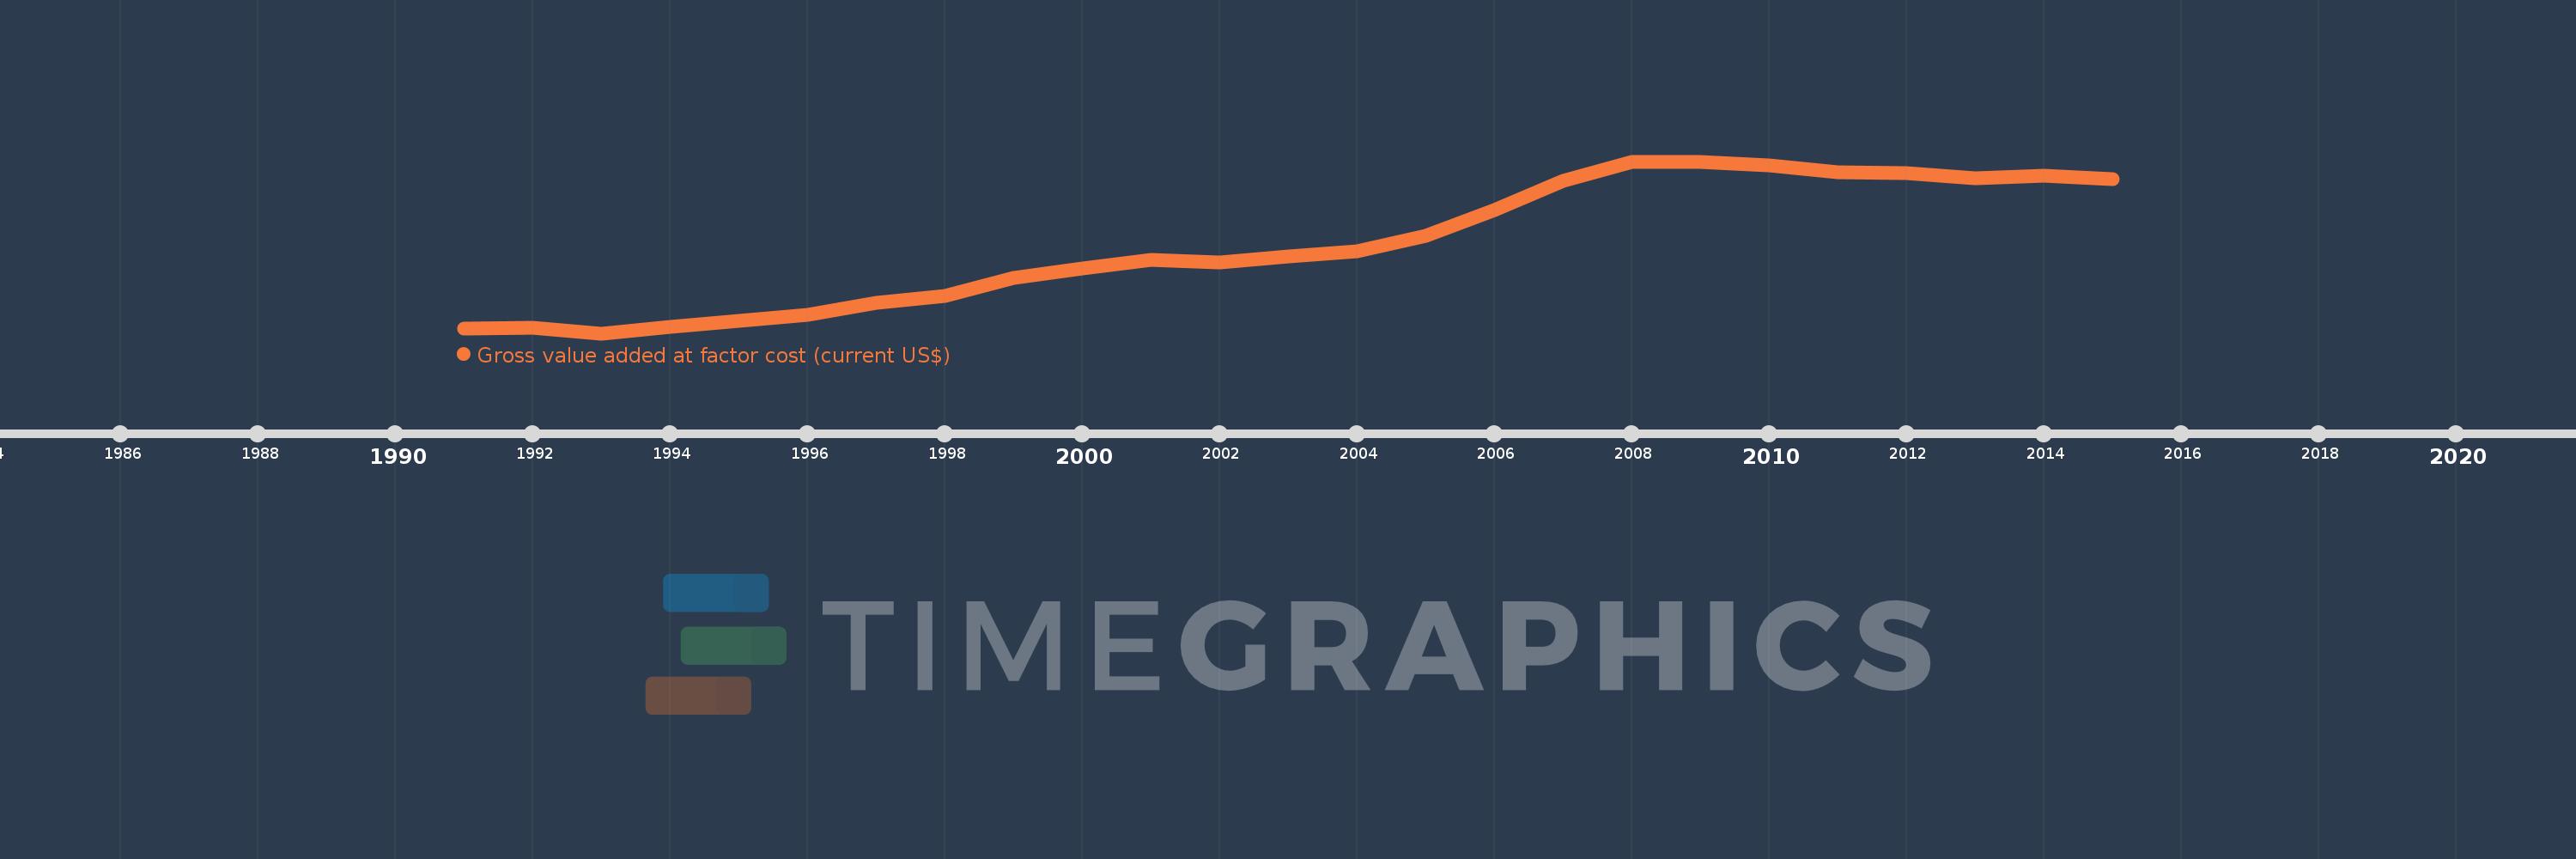
Gross value added at factor cost (current US$)
2015,2014,2013,2012,2011,2010,2009,2008,2007,2006,2005,2004,2003,2002,2001,2000,1999,1998,1997,1996,1995,1994,1993,1992,1991
This statistics in other country:
AfghanistanAlbaniaAlgeriaAndorraAntigua and BarbudaArgentinaArmeniaArubaAustraliaAustriaAzerbaijanBahamas, TheBahrainBangladeshBarbadosBelarusBelgiumBelizeBeninBermudaBhutanBoliviaBosnia and HerzegovinaBotswanaBrazilBulgariaBurkina FasoBurundiCabo VerdeCambodiaCameroonCanadaCaribbean small statesCayman IslandsCentral African RepublicCentral Europe and the BalticsChadChileColombiaCongo, Dem. Rep.Costa RicaCroatiaCubaCyprusCzech RepublicDenmarkDjiboutiDominicaDominican RepublicEarly-demographic dividendEcuadorEgypt, Arab Rep.El SalvadorEquatorial GuineaEritreaEstoniaEthiopiaEuro areaEurope & Central AsiaEurope & Central Asia (excluding high income)Europe & Central Asia (IDA & IBRD countries)European UnionFaroe IslandsFijiFinlandFranceGabonGambia, TheGeorgiaGermanyGhanaGreeceGrenadaGuatemalaGuineaGuinea-BissauGuyanaHeavily indebted poor countries (HIPC)High incomeHondurasHong Kong SAR, ChinaHungaryIcelandIDA blendIDA onlyIDA totalIndiaIndonesiaIran, Islamic Rep.IrelandItalyJamaicaJapanJordanKazakhstanKenyaKiribatiKorea, Rep.KosovoKuwaitKyrgyz RepublicLao PDRLatin America & Caribbean Latin America & Caribbean (excluding high income)Latin America & the Caribbean (IDA & IBRD countries)LatviaLeast developed countries: UN classificationLebanonLesothoLiberiaLibyaLiechtensteinLithuaniaLow incomeLower middle incomeLuxembourgMacao SAR, ChinaMacedonia, FYRMadagascarMalawiMalaysiaMaldivesMaliMaltaMarshall IslandsMauritaniaMauritiusMexicoMicronesia, Fed. Sts.Middle East & North Africa (excluding high income)Middle East & North Africa (IDA & IBRD countries)MoldovaMongoliaMontenegroMoroccoMozambiqueNamibiaNepalNetherlandsNew ZealandNicaraguaNigeriaNorth AmericaNorwayOECD membersOmanPacific island small statesPakistanPalauPanamaPapua New GuineaParaguayPeruPolandPortugalPost-demographic dividendPre-demographic dividendRomaniaRussian FederationRwandaSao Tome and PrincipeSenegalSerbiaSeychellesSierra LeoneSingaporeSlovak RepublicSloveniaSolomon IslandsSouth AfricaSouth AsiaSouth Asia (IDA & IBRD)SpainSri LankaSt. Kitts and NevisSt. LuciaSt. Vincent and the GrenadinesSub-Saharan Africa Sub-Saharan Africa (excluding high income)Sub-Saharan Africa (IDA & IBRD countries)SudanSurinameSwazilandSwedenSwitzerlandSyrian Arab RepublicTajikistanTanzaniaThailandTimor-LesteTongaTrinidad and TobagoTunisiaTurkeyTurkmenistanTuvaluUgandaUkraineUnited KingdomUnited StatesUruguayUzbekistanVanuatuVenezuela, RBVietnamWest Bank and GazaWorldYemen, Rep.ZambiaZimbabwe Timeline:
This timeline shows a graph from 1991 to 2015 of Barbados. No data until 1990. Number of actual observations by date: 25.
Source name:
World Development Indicators
Source organization:
World Bank national accounts data, and OECD National Accounts data files.
Categories, topics:
Economy & Growth
Last updated:
apr 23, 2017
Indicators value changes by year
Minimum:
1.735 bln
jan 1, 1993
Maximum:
3.886 bln
jan 1, 2008
At the date of observation
Value
Absolute change
Change from previous value
jan 1, 1991
1.798 bln
+1.798 bln
0.0%
jan 1, 1992
1.805 bln
+7.199 mln
0.4%
jan 1, 1993
1.735 bln
-69.795 mln
-3.87%
jan 1, 1994
1.811 bln
+76.024 mln
4.38%
jan 1, 1995
1.895 bln
+83.841 mln
4.63%
jan 1, 1996
1.97 bln
+74.715 mln
3.94%
jan 1, 1997
2.112 bln
+141.994 mln
7.21%
jan 1, 1998
2.207 bln
+94.805 mln
4.49%
jan 1, 1999
2.426 bln
+219.5 mln
9.95%
jan 1, 2000
2.547 bln
+121.052 mln
4.99%
jan 1, 2001
2.655 bln
+107.971 mln
4.24%
jan 1, 2002
2.623 bln
-31.887 mln
-1.2%
jan 1, 2003
2.695 bln
+71.63 mln
2.73%
jan 1, 2004
2.762 bln
+66.744 mln
2.48%
jan 1, 2005
2.954 bln
+192.814 mln
6.98%
jan 1, 2006
3.277 bln
+322.497 mln
10.92%
jan 1, 2007
3.645 bln
+368.008 mln
11.23%
jan 1, 2008
3.886 bln
+240.79 mln
6.61%
jan 1, 2009
3.885 bln
-500.722K
-0.01%
jan 1, 2010
3.834 bln
-50.714 mln
-1.31%
jan 1, 2011
3.752 bln
-81.971 mln
-2.14%
jan 1, 2012
3.738 bln
-14.36 mln
-0.38%
jan 1, 2013
3.675 bln
-63.529 mln
-1.7%
jan 1, 2014
3.705 bln
+30.606 mln
0.83%
jan 1, 2015
3.665 bln
-40.512 mln
-1.09%
Ranking of countries by current statistics by years


Comments: