29
/
en
AIzaSyAYiBZKx7MnpbEhh9jyipgxe19OcubqV5w
April 1, 2024
69891
Argentina
ARG
true
2
1
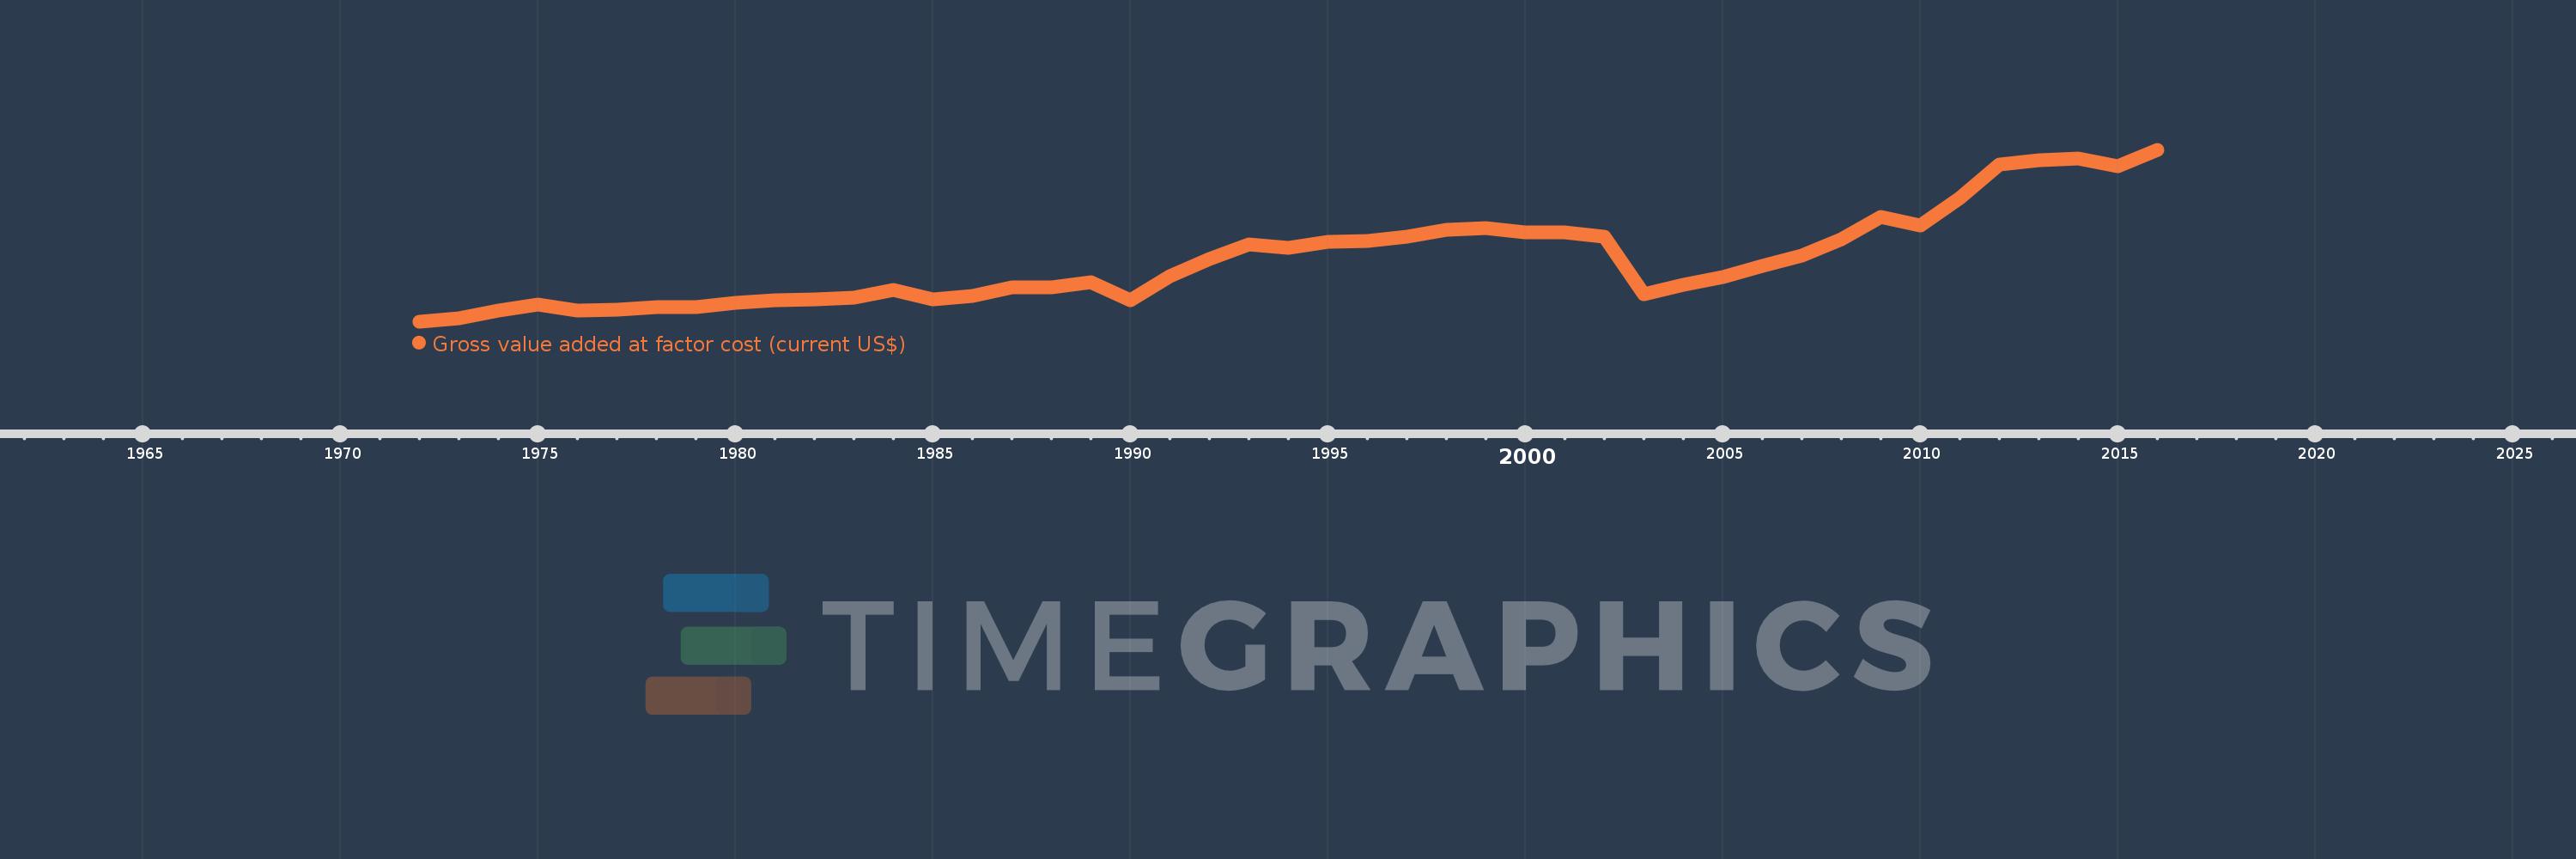
Gross value added at factor cost (current US$)
2016,2015,2014,2013,2012,2011,2010,2009,2008,2007,2006,2005,2004,2003,2002,2001,2000,1999,1998,1997,1996,1995,1994,1993,1992,1991,1990,1989,1988,1987,1986,1985,1984,1983,1982,1981,1980,1979,1978,1977,1976,1975,1974,1973,1972
This statistics in other country:
AfghanistanAlbaniaAlgeriaAndorraAntigua and BarbudaArgentinaArmeniaArubaAustraliaAustriaAzerbaijanBahamas, TheBahrainBangladeshBarbadosBelarusBelgiumBelizeBeninBermudaBhutanBoliviaBosnia and HerzegovinaBotswanaBrazilBulgariaBurkina FasoBurundiCabo VerdeCambodiaCameroonCanadaCaribbean small statesCayman IslandsCentral African RepublicCentral Europe and the BalticsChadChileColombiaCongo, Dem. Rep.Costa RicaCroatiaCubaCyprusCzech RepublicDenmarkDjiboutiDominicaDominican RepublicEarly-demographic dividendEcuadorEgypt, Arab Rep.El SalvadorEquatorial GuineaEritreaEstoniaEthiopiaEuro areaEurope & Central AsiaEurope & Central Asia (excluding high income)Europe & Central Asia (IDA & IBRD countries)European UnionFaroe IslandsFijiFinlandFranceGabonGambia, TheGeorgiaGermanyGhanaGreeceGrenadaGuatemalaGuineaGuinea-BissauGuyanaHeavily indebted poor countries (HIPC)High incomeHondurasHong Kong SAR, ChinaHungaryIcelandIDA blendIDA onlyIDA totalIndiaIndonesiaIran, Islamic Rep.IrelandItalyJamaicaJapanJordanKazakhstanKenyaKiribatiKorea, Rep.KosovoKuwaitKyrgyz RepublicLao PDRLatin America & Caribbean Latin America & Caribbean (excluding high income)Latin America & the Caribbean (IDA & IBRD countries)LatviaLeast developed countries: UN classificationLebanonLesothoLiberiaLibyaLiechtensteinLithuaniaLow incomeLower middle incomeLuxembourgMacao SAR, ChinaMacedonia, FYRMadagascarMalawiMalaysiaMaldivesMaliMaltaMarshall IslandsMauritaniaMauritiusMexicoMicronesia, Fed. Sts.Middle East & North Africa (excluding high income)Middle East & North Africa (IDA & IBRD countries)MoldovaMongoliaMontenegroMoroccoMozambiqueNamibiaNepalNetherlandsNew ZealandNicaraguaNigeriaNorth AmericaNorwayOECD membersOmanPacific island small statesPakistanPalauPanamaPapua New GuineaParaguayPeruPolandPortugalPost-demographic dividendPre-demographic dividendRomaniaRussian FederationRwandaSao Tome and PrincipeSenegalSerbiaSeychellesSierra LeoneSingaporeSlovak RepublicSloveniaSolomon IslandsSouth AfricaSouth AsiaSouth Asia (IDA & IBRD)SpainSri LankaSt. Kitts and NevisSt. LuciaSt. Vincent and the GrenadinesSub-Saharan Africa Sub-Saharan Africa (excluding high income)Sub-Saharan Africa (IDA & IBRD countries)SudanSurinameSwazilandSwedenSwitzerlandSyrian Arab RepublicTajikistanTanzaniaThailandTimor-LesteTongaTrinidad and TobagoTunisiaTurkeyTurkmenistanTuvaluUgandaUkraineUnited KingdomUnited StatesUruguayUzbekistanVanuatuVenezuela, RBVietnamWest Bank and GazaWorldYemen, Rep.ZambiaZimbabwe Timeline:
This timeline shows a graph from 1972 to 2016 of Argentina. No data until 1971. Number of actual observations by date: 45.
Source name:
World Development Indicators
Source organization:
World Bank national accounts data, and OECD National Accounts data files.
Categories, topics:
Economy & Growth
Last updated:
apr 23, 2017
Indicators value changes by year
Minimum:
16.646 bln
jan 1, 1972
Maximum:
488.818 bln
jan 1, 2016
At the date of observation
Value
Absolute change
Change from previous value
jan 1, 1972
16.646 bln
+16.646 bln
0.0%
jan 1, 1973
27.786 bln
+11.14 bln
66.92%
jan 1, 1974
47.29 bln
+19.503 bln
70.19%
jan 1, 1975
65.193 bln
+17.904 bln
37.86%
jan 1, 1976
48.506 bln
-16.687 bln
-25.6%
jan 1, 1977
51.169 bln
+2.664 bln
5.49%
jan 1, 1978
56.781 bln
+5.612 bln
10.97%
jan 1, 1979
58.083 bln
+1.302 bln
2.29%
jan 1, 1980
69.252 bln
+11.169 bln
19.23%
jan 1, 1981
76.962 bln
+7.71 bln
11.13%
jan 1, 1982
78.677 bln
+1.715 bln
2.23%
jan 1, 1983
84.307 bln
+5.631 bln
7.16%
jan 1, 1984
103.979 bln
+19.672 bln
23.33%
jan 1, 1985
79.092 bln
-24.887 bln
-23.93%
jan 1, 1986
88.417 bln
+9.325 bln
11.79%
jan 1, 1987
110.934 bln
+22.518 bln
25.47%
jan 1, 1988
111.106 bln
+171.746 mln
0.15%
jan 1, 1989
126.207 bln
+15.101 bln
13.59%
jan 1, 1990
76.637 bln
-49.57 bln
-39.28%
jan 1, 1991
141.352 bln
+64.715 bln
84.44%
jan 1, 1992
189.72 bln
+48.368 bln
34.22%
jan 1, 1993
228.789 bln
+39.069 bln
20.59%
jan 1, 1994
221.43 bln
-7.358 bln
-3.22%
jan 1, 1995
237.306 bln
+15.876 bln
7.17%
jan 1, 1996
238.612 bln
+1.306 bln
0.55%
jan 1, 1997
251.1 bln
+12.487 bln
5.23%
jan 1, 1998
269.558 bln
+18.458 bln
7.35%
jan 1, 1999
275.349 bln
+5.792 bln
2.15%
jan 1, 2000
262.474 bln
-12.875 bln
-4.68%
jan 1, 2001
263.219 bln
+744.5 mln
0.28%
jan 1, 2002
250.889 bln
-12.33 bln
-4.68%
jan 1, 2003
92.167 bln
-158.722 bln
-63.26%
jan 1, 2004
119.336 bln
+27.169 bln
29.48%
jan 1, 2005
139.986 bln
+20.65 bln
17.3%
jan 1, 2006
169.787 bln
+29.801 bln
21.29%
jan 1, 2007
198.438 bln
+28.651 bln
16.87%
jan 1, 2008
243.909 bln
+45.472 bln
22.91%
jan 1, 2009
304.734 bln
+60.824 bln
24.94%
jan 1, 2010
280.761 bln
-23.973 bln
-7.87%
jan 1, 2011
357.653 bln
+76.893 bln
27.39%
jan 1, 2012
448.498 bln
+90.845 bln
25.4%
jan 1, 2013
460.862 bln
+12.364 bln
2.76%
jan 1, 2014
465.709 bln
+4.847 bln
1.05%
jan 1, 2015
445.15 bln
-20.559 bln
-4.41%
jan 1, 2016
488.818 bln
+43.668 bln
9.81%
Ranking of countries by current statistics by years


Comments: