29
/
en
AIzaSyAYiBZKx7MnpbEhh9jyipgxe19OcubqV5w
April 1, 2024
193104
Mauritania
MRT
true
2
1
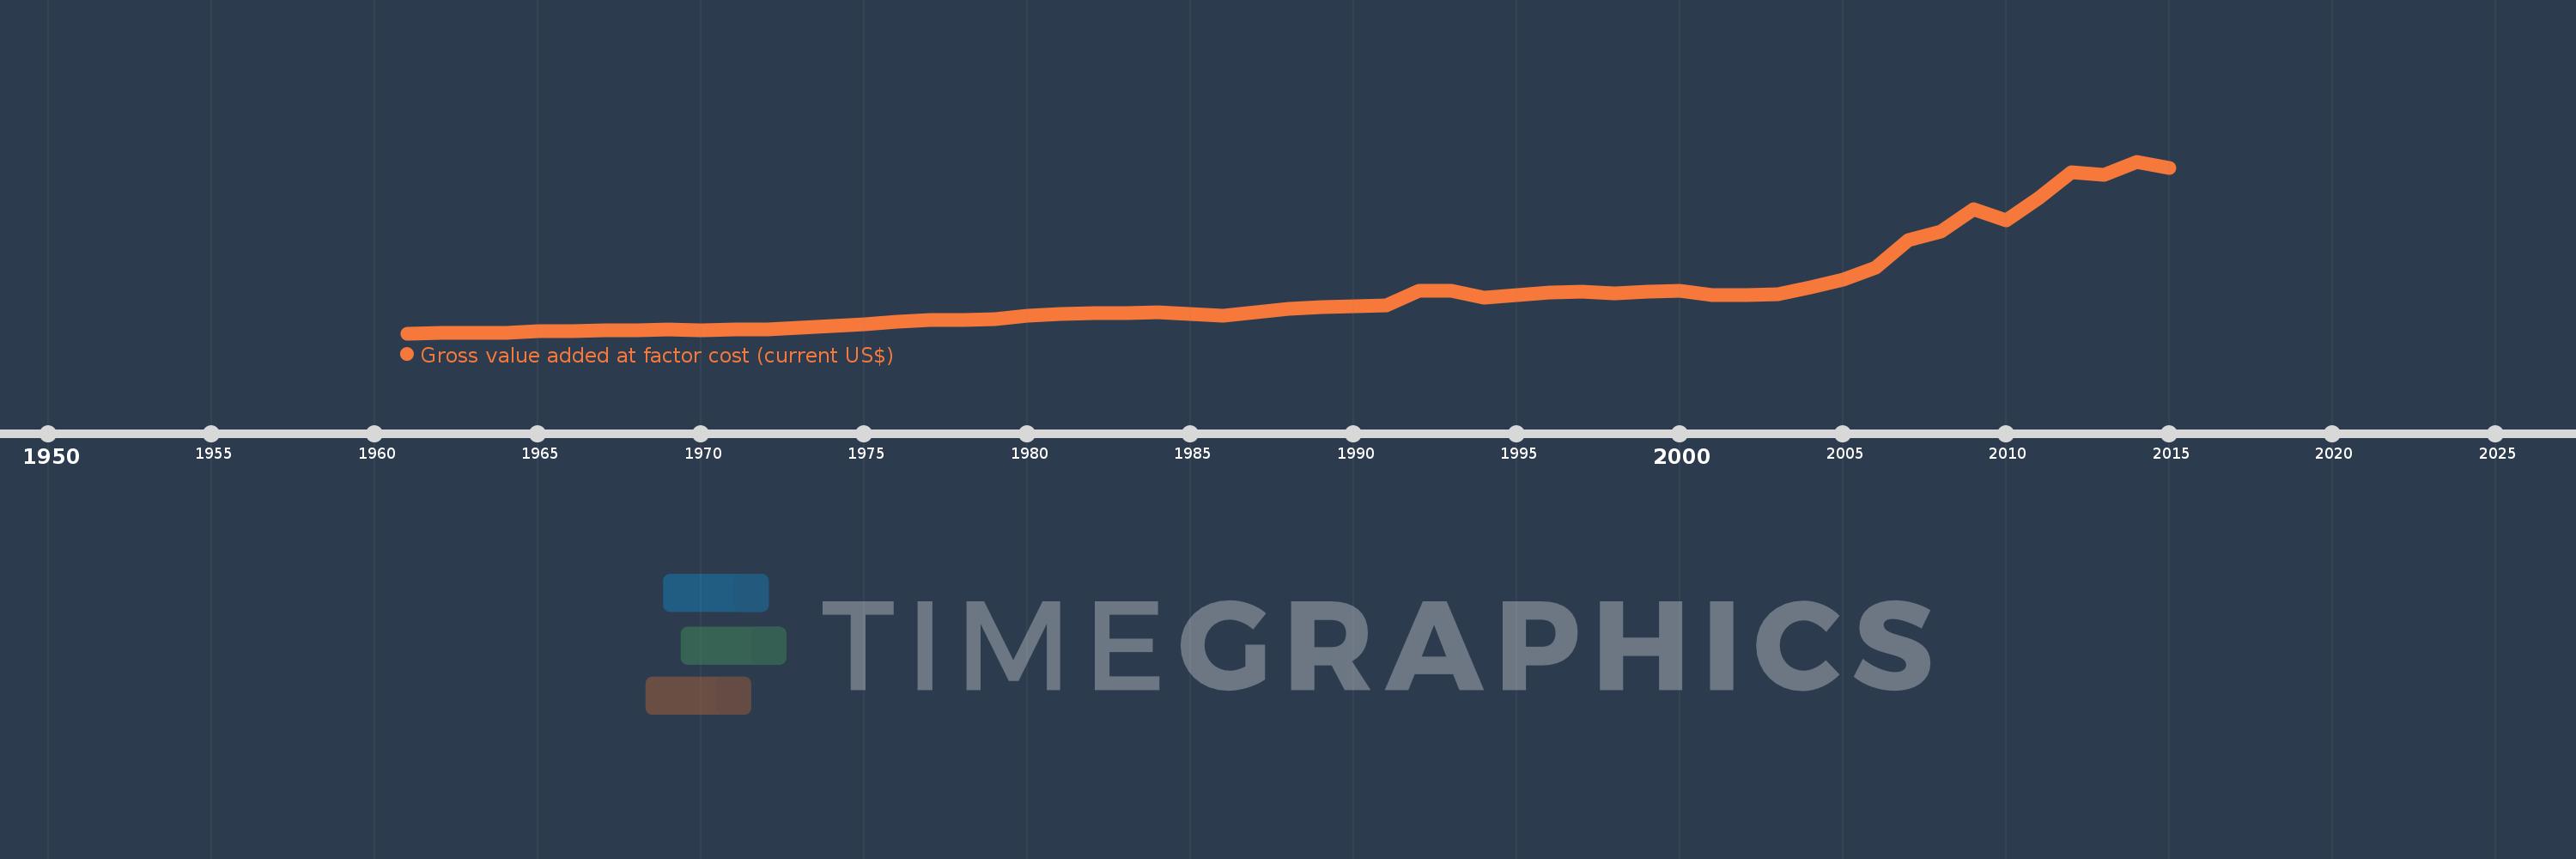
Gross value added at factor cost (current US$)
2015,2014,2013,2012,2011,2010,2009,2008,2007,2006,2005,2004,2003,2002,2001,2000,1999,1998,1997,1996,1995,1994,1993,1992,1991,1990,1989,1988,1987,1986,1985,1984,1983,1982,1981,1980,1979,1978,1977,1976,1975,1974,1973,1972,1971,1970,1969,1968,1967,1966,1965,1964,1963,1962,1961
This statistics in other country:
AfghanistanAlbaniaAlgeriaAndorraAntigua and BarbudaArgentinaArmeniaArubaAustraliaAustriaAzerbaijanBahamas, TheBahrainBangladeshBarbadosBelarusBelgiumBelizeBeninBermudaBhutanBoliviaBosnia and HerzegovinaBotswanaBrazilBulgariaBurkina FasoBurundiCabo VerdeCambodiaCameroonCanadaCaribbean small statesCayman IslandsCentral African RepublicCentral Europe and the BalticsChadChileColombiaCongo, Dem. Rep.Costa RicaCroatiaCubaCyprusCzech RepublicDenmarkDjiboutiDominicaDominican RepublicEarly-demographic dividendEcuadorEgypt, Arab Rep.El SalvadorEquatorial GuineaEritreaEstoniaEthiopiaEuro areaEurope & Central AsiaEurope & Central Asia (excluding high income)Europe & Central Asia (IDA & IBRD countries)European UnionFaroe IslandsFijiFinlandFranceGabonGambia, TheGeorgiaGermanyGhanaGreeceGrenadaGuatemalaGuineaGuinea-BissauGuyanaHeavily indebted poor countries (HIPC)High incomeHondurasHong Kong SAR, ChinaHungaryIcelandIDA blendIDA onlyIDA totalIndiaIndonesiaIran, Islamic Rep.IrelandItalyJamaicaJapanJordanKazakhstanKenyaKiribatiKorea, Rep.KosovoKuwaitKyrgyz RepublicLao PDRLatin America & Caribbean Latin America & Caribbean (excluding high income)Latin America & the Caribbean (IDA & IBRD countries)LatviaLeast developed countries: UN classificationLebanonLesothoLiberiaLibyaLiechtensteinLithuaniaLow incomeLower middle incomeLuxembourgMacao SAR, ChinaMacedonia, FYRMadagascarMalawiMalaysiaMaldivesMaliMaltaMarshall IslandsMauritaniaMauritiusMexicoMicronesia, Fed. Sts.Middle East & North Africa (excluding high income)Middle East & North Africa (IDA & IBRD countries)MoldovaMongoliaMontenegroMoroccoMozambiqueNamibiaNepalNetherlandsNew ZealandNicaraguaNigeriaNorth AmericaNorwayOECD membersOmanPacific island small statesPakistanPalauPanamaPapua New GuineaParaguayPeruPolandPortugalPost-demographic dividendPre-demographic dividendRomaniaRussian FederationRwandaSao Tome and PrincipeSenegalSerbiaSeychellesSierra LeoneSingaporeSlovak RepublicSloveniaSolomon IslandsSouth AfricaSouth AsiaSouth Asia (IDA & IBRD)SpainSri LankaSt. Kitts and NevisSt. LuciaSt. Vincent and the GrenadinesSub-Saharan Africa Sub-Saharan Africa (excluding high income)Sub-Saharan Africa (IDA & IBRD countries)SudanSurinameSwazilandSwedenSwitzerlandSyrian Arab RepublicTajikistanTanzaniaThailandTimor-LesteTongaTrinidad and TobagoTunisiaTurkeyTurkmenistanTuvaluUgandaUkraineUnited KingdomUnited StatesUruguayUzbekistanVanuatuVenezuela, RBVietnamWest Bank and GazaWorldYemen, Rep.ZambiaZimbabwe Timeline:
This timeline shows a graph from 1961 to 2015 of Mauritania. No data until 1960. Number of actual observations by date: 55.
Source name:
World Development Indicators
Source organization:
World Bank national accounts data, and OECD National Accounts data files.
Categories, topics:
Economy & Growth
Last updated:
apr 23, 2017
Indicators value changes by year
Minimum:
89.614 mln
jan 1, 1961
Maximum:
5.154 bln
jan 1, 2014
At the date of observation
Value
Absolute change
Change from previous value
jan 1, 1961
89.614 mln
+89.614 mln
0.0%
jan 1, 1962
100.879 mln
+11.265 mln
12.57%
jan 1, 1963
102.59 mln
+1.711 mln
1.7%
jan 1, 1964
104.168 mln
+1.579 mln
1.54%
jan 1, 1965
141.626 mln
+37.458 mln
35.96%
jan 1, 1966
162.068 mln
+20.442 mln
14.43%
jan 1, 1967
172.105 mln
+10.036 mln
6.19%
jan 1, 1968
180.952 mln
+8.847 mln
5.14%
jan 1, 1969
193.573 mln
+12.621 mln
6.97%
jan 1, 1970
175.233 mln
-18.34 mln
-9.47%
jan 1, 1971
196.745 mln
+21.512 mln
12.28%
jan 1, 1972
213.485 mln
+16.74 mln
8.51%
jan 1, 1973
246.137 mln
+32.652 mln
15.29%
jan 1, 1974
302.326 mln
+56.189 mln
22.83%
jan 1, 1975
363.662 mln
+61.336 mln
20.29%
jan 1, 1976
428.566 mln
+64.904 mln
17.85%
jan 1, 1977
469.746 mln
+41.18 mln
9.61%
jan 1, 1978
492.003 mln
+22.257 mln
4.74%
jan 1, 1979
502.941 mln
+10.937 mln
2.22%
jan 1, 1980
598.311 mln
+95.371 mln
18.96%
jan 1, 1981
665.569 mln
+67.258 mln
11.24%
jan 1, 1982
688.466 mln
+22.897 mln
3.44%
jan 1, 1983
679.96 mln
-8.505 mln
-1.24%
jan 1, 1984
703.664 mln
+23.703 mln
3.49%
jan 1, 1985
650.186 mln
-53.478 mln
-7.6%
jan 1, 1986
607.472 mln
-42.714 mln
-6.57%
jan 1, 1987
718.844 mln
+111.371 mln
18.33%
jan 1, 1988
816.234 mln
+97.391 mln
13.55%
jan 1, 1989
856.847 mln
+40.613 mln
4.98%
jan 1, 1990
886.997 mln
+30.15 mln
3.52%
jan 1, 1991
914.153 mln
+27.156 mln
3.06%
jan 1, 1992
1.335 bln
+420.817 mln
46.03%
jan 1, 1993
1.354 bln
+18.686 mln
1.4%
jan 1, 1994
1.143 bln
-210.362 mln
-15.54%
jan 1, 1995
1.207 bln
+64.097 mln
5.61%
jan 1, 1996
1.291 bln
+83.481 mln
6.91%
jan 1, 1997
1.314 bln
+22.863 mln
1.77%
jan 1, 1998
1.276 bln
-37.343 mln
-2.84%
jan 1, 1999
1.308 bln
+31.458 mln
2.46%
jan 1, 2000
1.339 bln
+31.044 mln
2.37%
jan 1, 2001
1.212 bln
-126.735 mln
-9.47%
jan 1, 2002
1.216 bln
+3.913 mln
0.32%
jan 1, 2003
1.236 bln
+19.592 mln
1.61%
jan 1, 2004
1.452 bln
+216.528 mln
17.52%
jan 1, 2005
1.684 bln
+231.577 mln
15.95%
jan 1, 2006
2.017 bln
+332.806 mln
19.77%
jan 1, 2007
2.839 bln
+822.775 mln
40.8%
jan 1, 2008
3.1 bln
+260.705 mln
9.18%
jan 1, 2009
3.75 bln
+650.224 mln
20.97%
jan 1, 2010
3.425 bln
-324.842 mln
-8.66%
jan 1, 2011
4.066 bln
+640.069 mln
18.69%
jan 1, 2012
4.836 bln
+770.063 mln
18.94%
jan 1, 2013
4.75 bln
-85.151 mln
-1.76%
jan 1, 2014
5.154 bln
+403.516 mln
8.49%
jan 1, 2015
4.963 bln
-191.229 mln
-3.71%
Ranking of countries by current statistics by years


Comments: