29
/
en
AIzaSyAYiBZKx7MnpbEhh9jyipgxe19OcubqV5w
April 1, 2024
260981
Tanzania
TZA
true
2
1
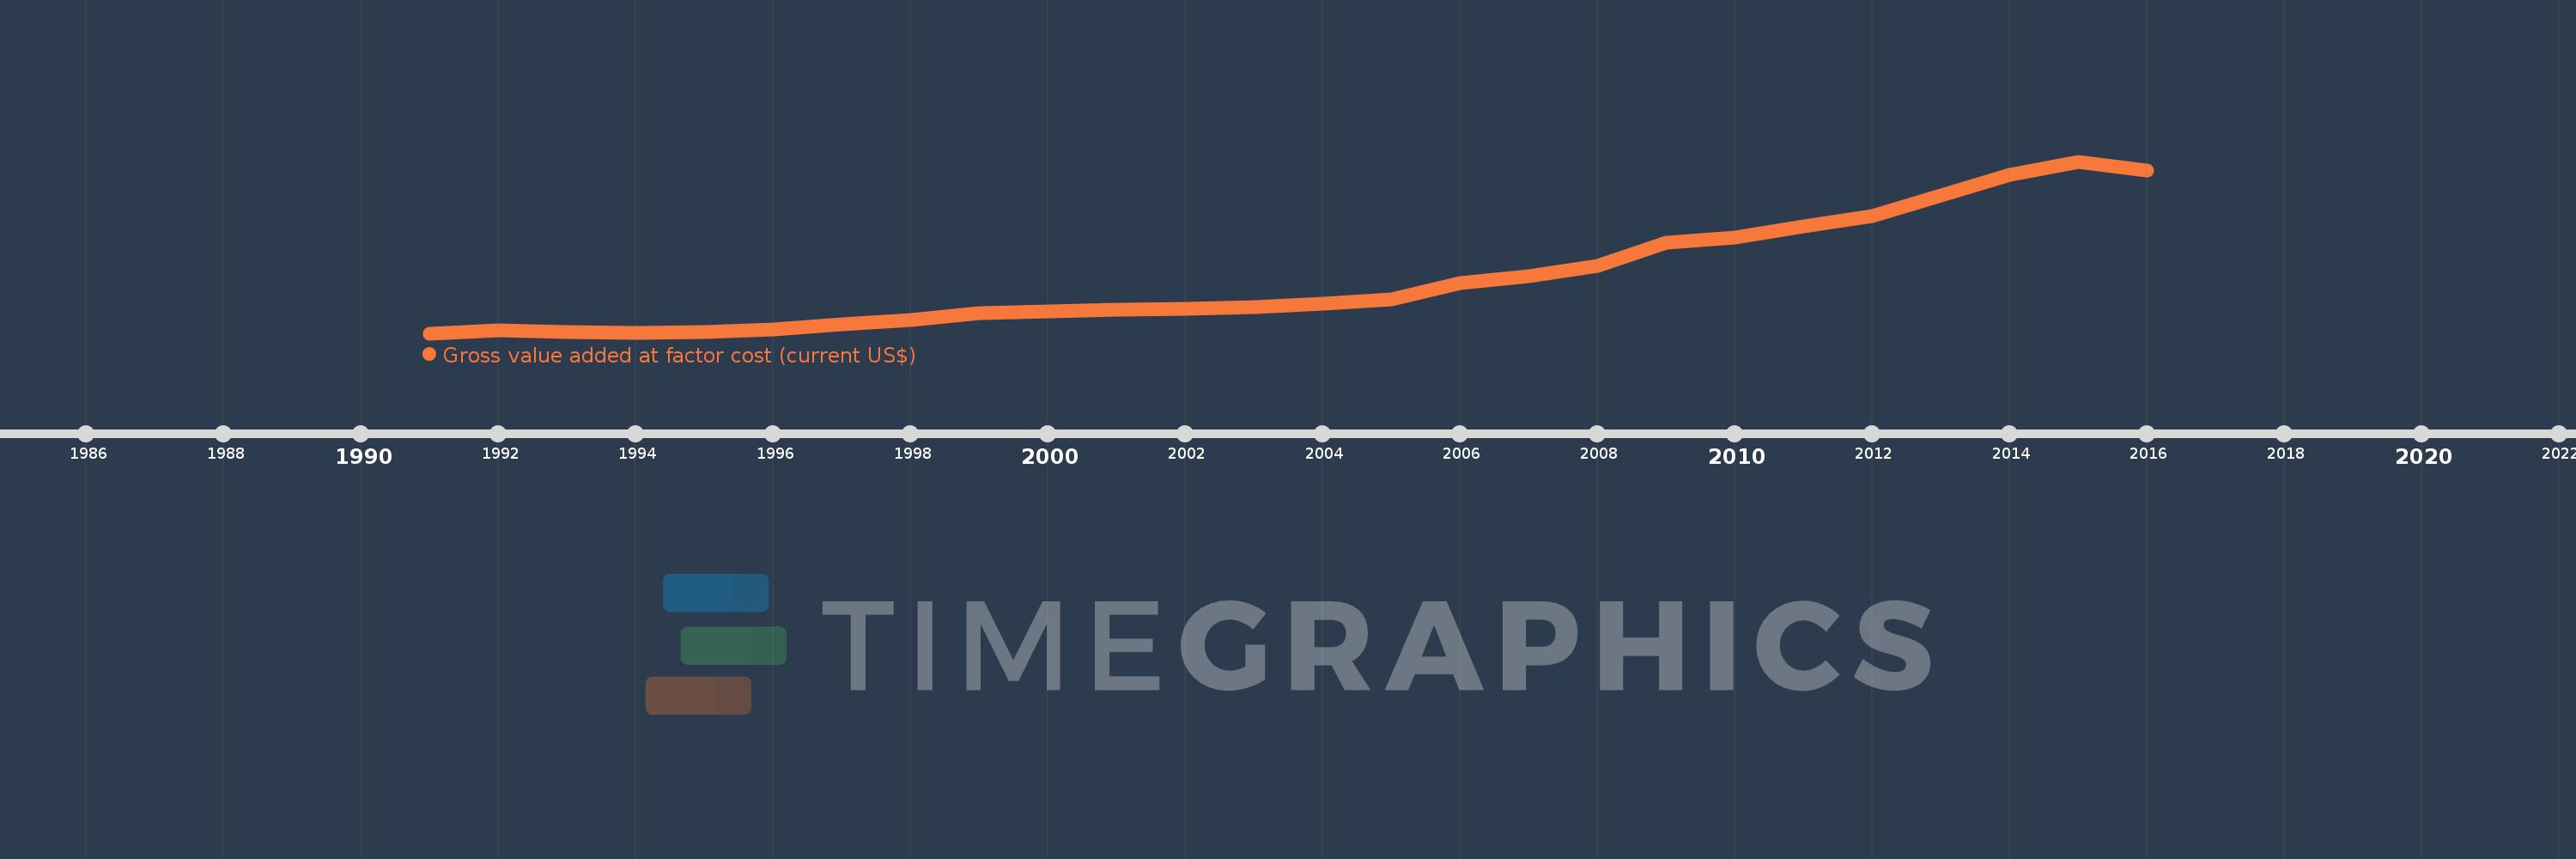
Gross value added at factor cost (current US$)
2016,2015,2014,2013,2012,2011,2010,2009,2008,2007,2006,2005,2004,2003,2002,2001,2000,1999,1998,1997,1996,1995,1994,1993,1992,1991
This statistics in other country:
AfghanistanAlbaniaAlgeriaAndorraAntigua and BarbudaArgentinaArmeniaArubaAustraliaAustriaAzerbaijanBahamas, TheBahrainBangladeshBarbadosBelarusBelgiumBelizeBeninBermudaBhutanBoliviaBosnia and HerzegovinaBotswanaBrazilBulgariaBurkina FasoBurundiCabo VerdeCambodiaCameroonCanadaCaribbean small statesCayman IslandsCentral African RepublicCentral Europe and the BalticsChadChileColombiaCongo, Dem. Rep.Costa RicaCroatiaCubaCyprusCzech RepublicDenmarkDjiboutiDominicaDominican RepublicEarly-demographic dividendEcuadorEgypt, Arab Rep.El SalvadorEquatorial GuineaEritreaEstoniaEthiopiaEuro areaEurope & Central AsiaEurope & Central Asia (excluding high income)Europe & Central Asia (IDA & IBRD countries)European UnionFaroe IslandsFijiFinlandFranceGabonGambia, TheGeorgiaGermanyGhanaGreeceGrenadaGuatemalaGuineaGuinea-BissauGuyanaHeavily indebted poor countries (HIPC)High incomeHondurasHong Kong SAR, ChinaHungaryIcelandIDA blendIDA onlyIDA totalIndiaIndonesiaIran, Islamic Rep.IrelandItalyJamaicaJapanJordanKazakhstanKenyaKiribatiKorea, Rep.KosovoKuwaitKyrgyz RepublicLao PDRLatin America & Caribbean Latin America & Caribbean (excluding high income)Latin America & the Caribbean (IDA & IBRD countries)LatviaLeast developed countries: UN classificationLebanonLesothoLiberiaLibyaLiechtensteinLithuaniaLow incomeLower middle incomeLuxembourgMacao SAR, ChinaMacedonia, FYRMadagascarMalawiMalaysiaMaldivesMaliMaltaMarshall IslandsMauritaniaMauritiusMexicoMicronesia, Fed. Sts.Middle East & North Africa (excluding high income)Middle East & North Africa (IDA & IBRD countries)MoldovaMongoliaMontenegroMoroccoMozambiqueNamibiaNepalNetherlandsNew ZealandNicaraguaNigeriaNorth AmericaNorwayOECD membersOmanPacific island small statesPakistanPalauPanamaPapua New GuineaParaguayPeruPolandPortugalPost-demographic dividendPre-demographic dividendRomaniaRussian FederationRwandaSao Tome and PrincipeSenegalSerbiaSeychellesSierra LeoneSingaporeSlovak RepublicSloveniaSolomon IslandsSouth AfricaSouth AsiaSouth Asia (IDA & IBRD)SpainSri LankaSt. Kitts and NevisSt. LuciaSt. Vincent and the GrenadinesSub-Saharan Africa Sub-Saharan Africa (excluding high income)Sub-Saharan Africa (IDA & IBRD countries)SudanSurinameSwazilandSwedenSwitzerlandSyrian Arab RepublicTajikistanTanzaniaThailandTimor-LesteTongaTrinidad and TobagoTunisiaTurkeyTurkmenistanTuvaluUgandaUkraineUnited KingdomUnited StatesUruguayUzbekistanVanuatuVenezuela, RBVietnamWest Bank and GazaWorldYemen, Rep.ZambiaZimbabwe Timeline:
This timeline shows a graph from 1991 to 2016 of Tanzania. No data until 1990. Number of actual observations by date: 26.
Source name:
World Development Indicators
Source organization:
World Bank national accounts data, and OECD National Accounts data files.
Categories, topics:
Economy & Growth
Last updated:
apr 23, 2017
Indicators value changes by year
Minimum:
3.896 bln
jan 1, 1991
Maximum:
44.789 bln
jan 1, 2015
At the date of observation
Value
Absolute change
Change from previous value
jan 1, 1991
3.896 bln
+3.896 bln
0.0%
jan 1, 1992
4.515 bln
+619.095 mln
15.89%
jan 1, 1993
4.286 bln
-229.635 mln
-5.09%
jan 1, 1994
3.967 bln
-318.71 mln
-7.44%
jan 1, 1995
4.17 bln
+203.223 mln
5.12%
jan 1, 1996
4.866 bln
+695.418 mln
16.68%
jan 1, 1997
5.953 bln
+1.087 bln
22.34%
jan 1, 1998
6.995 bln
+1.042 bln
17.5%
jan 1, 1999
8.713 bln
+1.718 bln
24.56%
jan 1, 2000
9.122 bln
+409.434 mln
4.7%
jan 1, 2001
9.525 bln
+402.334 mln
4.41%
jan 1, 2002
9.685 bln
+160.573 mln
1.69%
jan 1, 2003
10.077 bln
+391.408 mln
4.04%
jan 1, 2004
10.858 bln
+781.527 mln
7.76%
jan 1, 2005
11.909 bln
+1.051 bln
9.68%
jan 1, 2006
15.902 bln
+3.994 bln
33.53%
jan 1, 2007
17.452 bln
+1.55 bln
9.75%
jan 1, 2008
20.039 bln
+2.586 bln
14.82%
jan 1, 2009
25.554 bln
+5.515 bln
27.52%
jan 1, 2010
26.695 bln
+1.141 bln
4.47%
jan 1, 2011
29.391 bln
+2.696 bln
10.1%
jan 1, 2012
31.784 bln
+2.394 bln
8.14%
jan 1, 2013
36.625 bln
+4.841 bln
15.23%
jan 1, 2014
41.534 bln
+4.909 bln
13.4%
jan 1, 2015
44.789 bln
+3.255 bln
7.84%
jan 1, 2016
42.569 bln
-2.22 bln
-4.96%
Ranking of countries by current statistics by years


Comments: