29
/
en
AIzaSyAYiBZKx7MnpbEhh9jyipgxe19OcubqV5w
April 1, 2024
44305
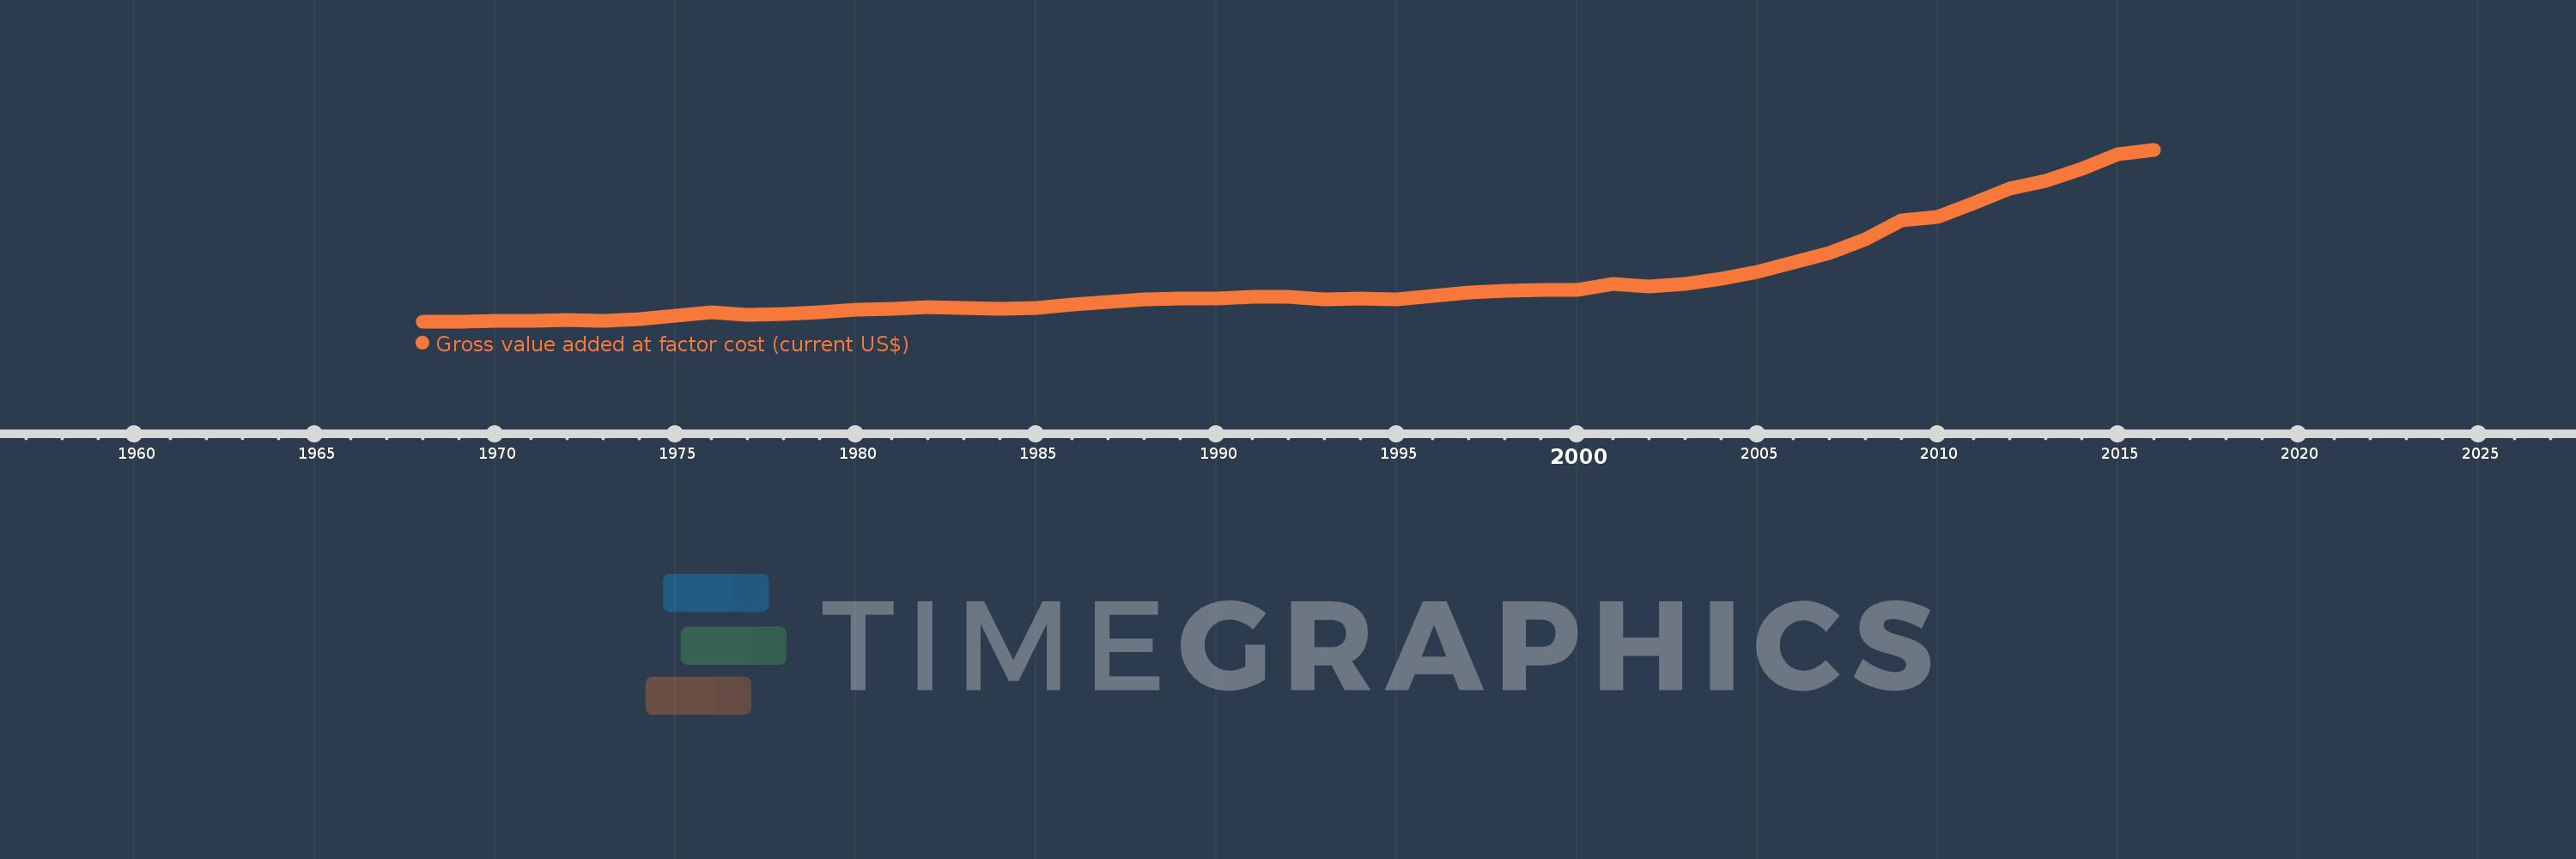
Least developed countries: UN classification
LDC
false
2
1
Gross value added at factor cost (current US$)
2016,2015,2014,2013,2012,2011,2010,2009,2008,2007,2006,2005,2004,2003,2002,2001,2000,1999,1998,1997,1996,1995,1994,1993,1992,1991,1990,1989,1988,1987,1986,1985,1984,1983,1982,1981,1980,1979,1978,1977,1976,1975,1974,1973,1972,1971,1970,1969,1968
This statistics in other country:
AfghanistanAlbaniaAlgeriaAndorraAntigua and BarbudaArgentinaArmeniaArubaAustraliaAustriaAzerbaijanBahamas, TheBahrainBangladeshBarbadosBelarusBelgiumBelizeBeninBermudaBhutanBoliviaBosnia and HerzegovinaBotswanaBrazilBulgariaBurkina FasoBurundiCabo VerdeCambodiaCameroonCanadaCaribbean small statesCayman IslandsCentral African RepublicCentral Europe and the BalticsChadChileColombiaCongo, Dem. Rep.Costa RicaCroatiaCubaCyprusCzech RepublicDenmarkDjiboutiDominicaDominican RepublicEarly-demographic dividendEcuadorEgypt, Arab Rep.El SalvadorEquatorial GuineaEritreaEstoniaEthiopiaEuro areaEurope & Central AsiaEurope & Central Asia (excluding high income)Europe & Central Asia (IDA & IBRD countries)European UnionFaroe IslandsFijiFinlandFranceGabonGambia, TheGeorgiaGermanyGhanaGreeceGrenadaGuatemalaGuineaGuinea-BissauGuyanaHeavily indebted poor countries (HIPC)High incomeHondurasHong Kong SAR, ChinaHungaryIcelandIDA blendIDA onlyIDA totalIndiaIndonesiaIran, Islamic Rep.IrelandItalyJamaicaJapanJordanKazakhstanKenyaKiribatiKorea, Rep.KosovoKuwaitKyrgyz RepublicLao PDRLatin America & Caribbean Latin America & Caribbean (excluding high income)Latin America & the Caribbean (IDA & IBRD countries)LatviaLeast developed countries: UN classificationLebanonLesothoLiberiaLibyaLiechtensteinLithuaniaLow incomeLower middle incomeLuxembourgMacao SAR, ChinaMacedonia, FYRMadagascarMalawiMalaysiaMaldivesMaliMaltaMarshall IslandsMauritaniaMauritiusMexicoMicronesia, Fed. Sts.Middle East & North Africa (excluding high income)Middle East & North Africa (IDA & IBRD countries)MoldovaMongoliaMontenegroMoroccoMozambiqueNamibiaNepalNetherlandsNew ZealandNicaraguaNigeriaNorth AmericaNorwayOECD membersOmanPacific island small statesPakistanPalauPanamaPapua New GuineaParaguayPeruPolandPortugalPost-demographic dividendPre-demographic dividendRomaniaRussian FederationRwandaSao Tome and PrincipeSenegalSerbiaSeychellesSierra LeoneSingaporeSlovak RepublicSloveniaSolomon IslandsSouth AfricaSouth AsiaSouth Asia (IDA & IBRD)SpainSri LankaSt. Kitts and NevisSt. LuciaSt. Vincent and the GrenadinesSub-Saharan Africa Sub-Saharan Africa (excluding high income)Sub-Saharan Africa (IDA & IBRD countries)SudanSurinameSwazilandSwedenSwitzerlandSyrian Arab RepublicTajikistanTanzaniaThailandTimor-LesteTongaTrinidad and TobagoTunisiaTurkeyTurkmenistanTuvaluUgandaUkraineUnited KingdomUnited StatesUruguayUzbekistanVanuatuVenezuela, RBVietnamWest Bank and GazaWorldYemen, Rep.ZambiaZimbabwe Timeline:
This timeline shows a graph from 1968 to 2016 of Least developed countries: UN classification. No data until 1967. Number of actual observations by date: 49.
Source name:
World Development Indicators
Source organization:
World Bank national accounts data, and OECD National Accounts data files.
Categories, topics:
Economy & Growth
Last updated:
apr 23, 2017
Indicators value changes by year
Minimum:
36.423 bln
jan 1, 1968
Maximum:
911.407 bln
jan 1, 2016
At the date of observation
Value
Absolute change
Change from previous value
jan 1, 1968
36.423 bln
+36.423 bln
0.0%
jan 1, 1969
37.135 bln
+712.495 mln
1.96%
jan 1, 1970
40.799 bln
+3.664 bln
9.87%
jan 1, 1971
43.737 bln
+2.938 bln
7.2%
jan 1, 1972
44.503 bln
+765.645 mln
1.75%
jan 1, 1973
41.372 bln
-3.131 bln
-7.04%
jan 1, 1974
49.847 bln
+8.476 bln
20.49%
jan 1, 1975
66.646 bln
+16.799 bln
33.7%
jan 1, 1976
87.03 bln
+20.384 bln
30.58%
jan 1, 1977
70.826 bln
-16.204 bln
-18.62%
jan 1, 1978
76.375 bln
+5.549 bln
7.83%
jan 1, 1979
86.298 bln
+9.923 bln
12.99%
jan 1, 1980
100.304 bln
+14.006 bln
16.23%
jan 1, 1981
105.192 bln
+4.888 bln
4.87%
jan 1, 1982
111.561 bln
+6.369 bln
6.05%
jan 1, 1983
109.675 bln
-1.886 bln
-1.69%
jan 1, 1984
104.36 bln
-5.314 bln
-4.85%
jan 1, 1985
108.923 bln
+4.563 bln
4.37%
jan 1, 1986
124.01 bln
+15.087 bln
13.85%
jan 1, 1987
136.287 bln
+12.276 bln
9.9%
jan 1, 1988
152.151 bln
+15.864 bln
11.64%
jan 1, 1989
153.873 bln
+1.722 bln
1.13%
jan 1, 1990
157.296 bln
+3.423 bln
2.22%
jan 1, 1991
162.745 bln
+5.449 bln
3.46%
jan 1, 1992
165.942 bln
+3.197 bln
1.96%
jan 1, 1993
152.695 bln
-13.247 bln
-7.98%
jan 1, 1994
154.733 bln
+2.038 bln
1.33%
jan 1, 1995
152.661 bln
-2.073 bln
-1.34%
jan 1, 1996
171.155 bln
+18.494 bln
12.11%
jan 1, 1997
185.721 bln
+14.567 bln
8.51%
jan 1, 1998
196.17 bln
+10.448 bln
5.63%
jan 1, 1999
197.997 bln
+1.827 bln
0.93%
jan 1, 2000
200.077 bln
+2.08 bln
1.05%
jan 1, 2001
228.832 bln
+28.755 bln
14.37%
jan 1, 2002
218.775 bln
-10.056 bln
-4.39%
jan 1, 2003
231.549 bln
+12.774 bln
5.84%
jan 1, 2004
258.667 bln
+27.118 bln
11.71%
jan 1, 2005
293.309 bln
+34.642 bln
13.39%
jan 1, 2006
338.772 bln
+45.462 bln
15.5%
jan 1, 2007
386.19 bln
+47.419 bln
14.0%
jan 1, 2008
457.895 bln
+71.704 bln
18.57%
jan 1, 2009
555.506 bln
+97.611 bln
21.32%
jan 1, 2010
573.535 bln
+18.029 bln
3.25%
jan 1, 2011
641.326 bln
+67.791 bln
11.82%
jan 1, 2012
716.724 bln
+75.398 bln
11.76%
jan 1, 2013
755.053 bln
+38.329 bln
5.35%
jan 1, 2014
815.901 bln
+60.848 bln
8.06%
jan 1, 2015
890.498 bln
+74.597 bln
9.14%
jan 1, 2016
911.407 bln
+20.909 bln
2.35%
Ranking of countries by current statistics by years


Comments: