29
/
en
AIzaSyAYiBZKx7MnpbEhh9jyipgxe19OcubqV5w
April 1, 2024
168685
Kiribati
KIR
true
2
1
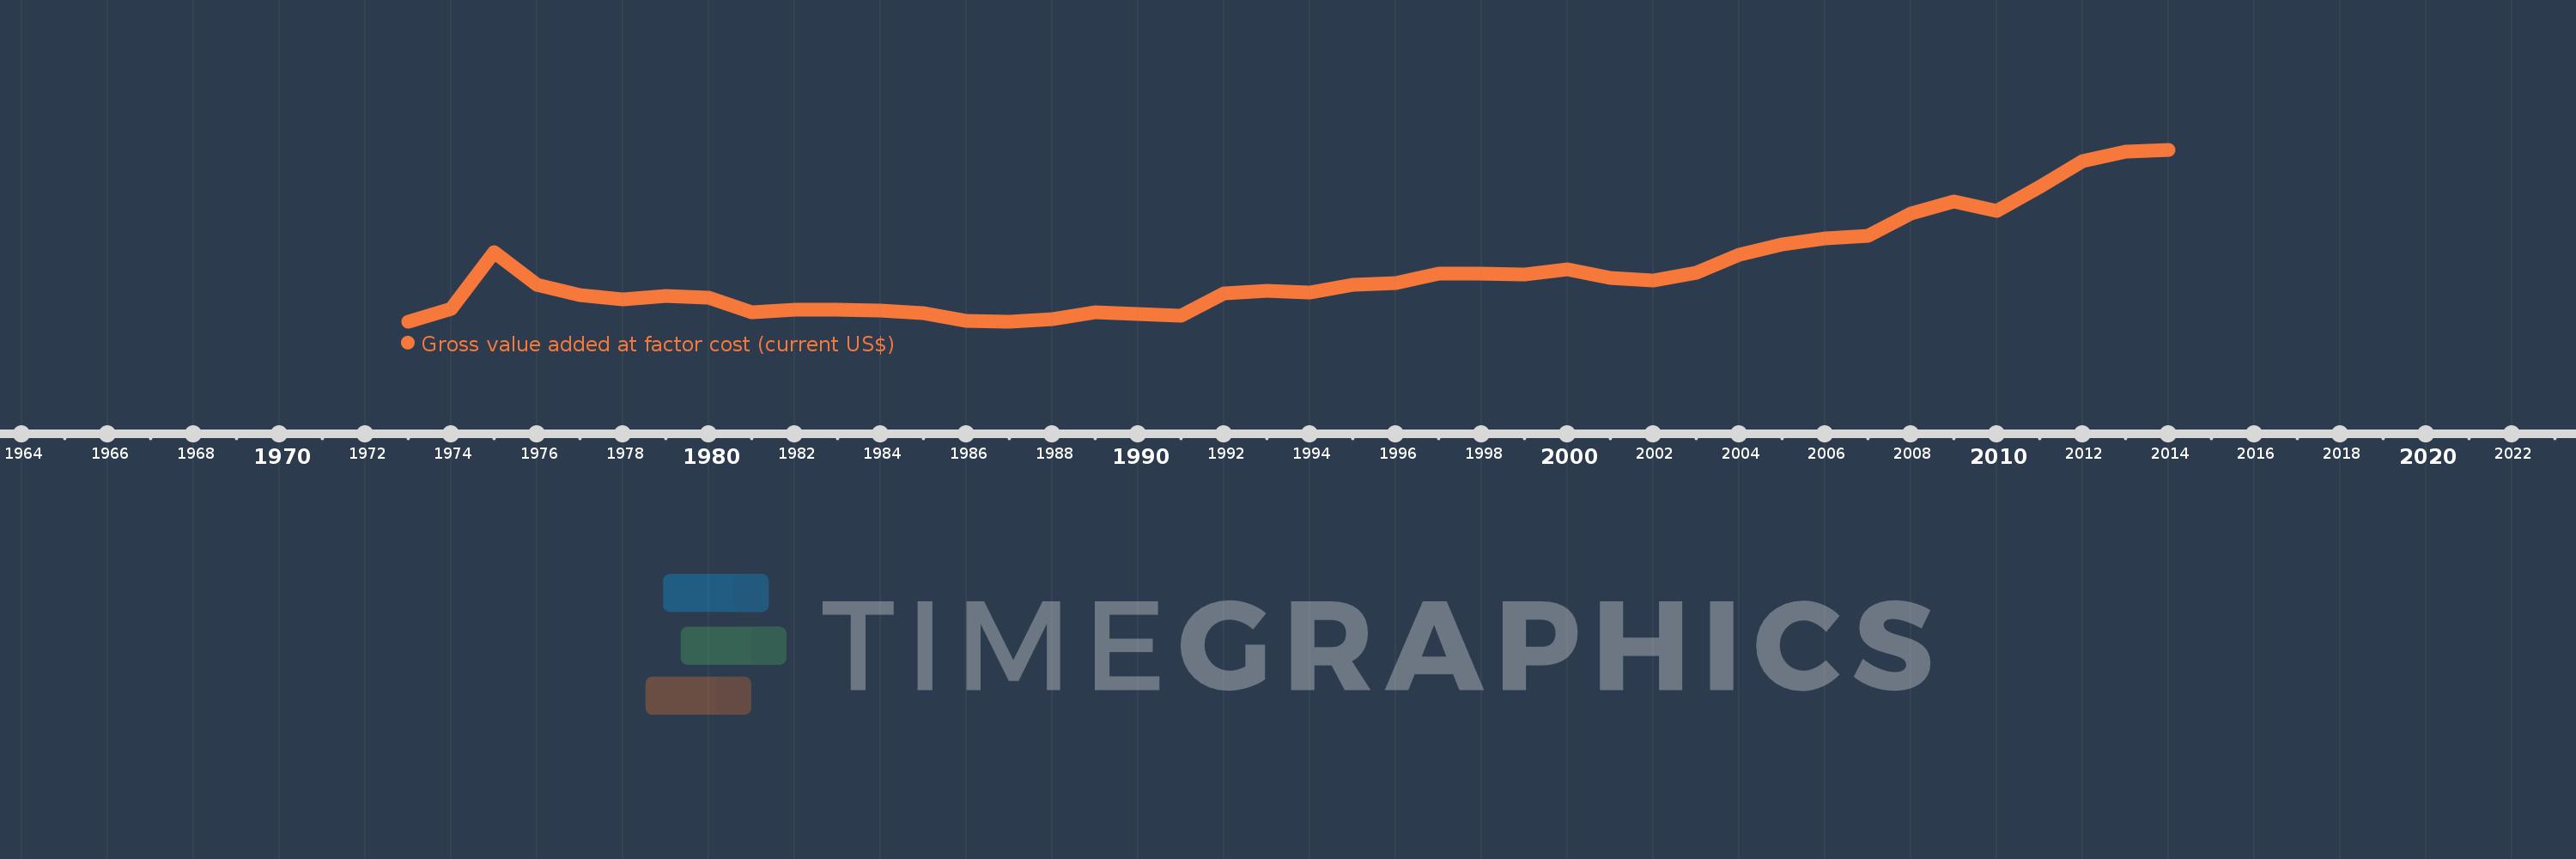
Gross value added at factor cost (current US$)
2014,2013,2012,2011,2010,2009,2008,2007,2006,2005,2004,2003,2002,2001,2000,1999,1998,1997,1996,1995,1994,1993,1992,1991,1990,1989,1988,1987,1986,1985,1984,1983,1982,1981,1980,1979,1978,1977,1976,1975,1974,1973
This statistics in other country:
AfghanistanAlbaniaAlgeriaAndorraAntigua and BarbudaArgentinaArmeniaArubaAustraliaAustriaAzerbaijanBahamas, TheBahrainBangladeshBarbadosBelarusBelgiumBelizeBeninBermudaBhutanBoliviaBosnia and HerzegovinaBotswanaBrazilBulgariaBurkina FasoBurundiCabo VerdeCambodiaCameroonCanadaCaribbean small statesCayman IslandsCentral African RepublicCentral Europe and the BalticsChadChileColombiaCongo, Dem. Rep.Costa RicaCroatiaCubaCyprusCzech RepublicDenmarkDjiboutiDominicaDominican RepublicEarly-demographic dividendEcuadorEgypt, Arab Rep.El SalvadorEquatorial GuineaEritreaEstoniaEthiopiaEuro areaEurope & Central AsiaEurope & Central Asia (excluding high income)Europe & Central Asia (IDA & IBRD countries)European UnionFaroe IslandsFijiFinlandFranceGabonGambia, TheGeorgiaGermanyGhanaGreeceGrenadaGuatemalaGuineaGuinea-BissauGuyanaHeavily indebted poor countries (HIPC)High incomeHondurasHong Kong SAR, ChinaHungaryIcelandIDA blendIDA onlyIDA totalIndiaIndonesiaIran, Islamic Rep.IrelandItalyJamaicaJapanJordanKazakhstanKenyaKiribatiKorea, Rep.KosovoKuwaitKyrgyz RepublicLao PDRLatin America & Caribbean Latin America & Caribbean (excluding high income)Latin America & the Caribbean (IDA & IBRD countries)LatviaLeast developed countries: UN classificationLebanonLesothoLiberiaLibyaLiechtensteinLithuaniaLow incomeLower middle incomeLuxembourgMacao SAR, ChinaMacedonia, FYRMadagascarMalawiMalaysiaMaldivesMaliMaltaMarshall IslandsMauritaniaMauritiusMexicoMicronesia, Fed. Sts.Middle East & North Africa (excluding high income)Middle East & North Africa (IDA & IBRD countries)MoldovaMongoliaMontenegroMoroccoMozambiqueNamibiaNepalNetherlandsNew ZealandNicaraguaNigeriaNorth AmericaNorwayOECD membersOmanPacific island small statesPakistanPalauPanamaPapua New GuineaParaguayPeruPolandPortugalPost-demographic dividendPre-demographic dividendRomaniaRussian FederationRwandaSao Tome and PrincipeSenegalSerbiaSeychellesSierra LeoneSingaporeSlovak RepublicSloveniaSolomon IslandsSouth AfricaSouth AsiaSouth Asia (IDA & IBRD)SpainSri LankaSt. Kitts and NevisSt. LuciaSt. Vincent and the GrenadinesSub-Saharan Africa Sub-Saharan Africa (excluding high income)Sub-Saharan Africa (IDA & IBRD countries)SudanSurinameSwazilandSwedenSwitzerlandSyrian Arab RepublicTajikistanTanzaniaThailandTimor-LesteTongaTrinidad and TobagoTunisiaTurkeyTurkmenistanTuvaluUgandaUkraineUnited KingdomUnited StatesUruguayUzbekistanVanuatuVenezuela, RBVietnamWest Bank and GazaWorldYemen, Rep.ZambiaZimbabwe Timeline:
This timeline shows a graph from 1973 to 2014 of Kiribati. No data until 1972. Number of actual observations by date: 42.
Source name:
World Development Indicators
Source organization:
World Bank national accounts data, and OECD National Accounts data files.
Categories, topics:
Economy & Growth
Last updated:
apr 23, 2017
Indicators value changes by year
Minimum:
17.719 mln
jan 1, 1987
Maximum:
180.396 mln
jan 1, 2014
At the date of observation
Value
Absolute change
Change from previous value
jan 1, 1973
18.206 mln
+18.206 mln
0.0%
jan 1, 1974
30.361 mln
+12.155 mln
66.76%
jan 1, 1975
83.797 mln
+53.436 mln
176.0%
jan 1, 1976
53.008 mln
-30.789 mln
-36.74%
jan 1, 1977
43.341 mln
-9.667 mln
-18.24%
jan 1, 1978
38.868 mln
-4.473 mln
-10.32%
jan 1, 1979
42.578 mln
+3.71 mln
9.54%
jan 1, 1980
40.442 mln
-2.136 mln
-5.02%
jan 1, 1981
26.678 mln
-13.763 mln
-34.03%
jan 1, 1982
29.107 mln
+2.429 mln
9.1%
jan 1, 1983
29.719 mln
+611.937K
2.1%
jan 1, 1984
28.544 mln
-1.175 mln
-3.95%
jan 1, 1985
25.704 mln
-2.84 mln
-9.95%
jan 1, 1986
18.709 mln
-6.996 mln
-27.22%
jan 1, 1987
17.719 mln
-989.457K
-5.29%
jan 1, 1988
20.149 mln
+2.43 mln
13.71%
jan 1, 1989
26.78 mln
+6.631 mln
32.91%
jan 1, 1990
25.336 mln
-1.444 mln
-5.39%
jan 1, 1991
23.826 mln
-1.51 mln
-5.96%
jan 1, 1992
44.991 mln
+21.165 mln
88.83%
jan 1, 1993
47.312 mln
+2.322 mln
5.16%
jan 1, 1994
45.48 mln
-1.833 mln
-3.87%
jan 1, 1995
53.21 mln
+7.73 mln
17.0%
jan 1, 1996
54.364 mln
+1.154 mln
2.17%
jan 1, 1997
63.376 mln
+9.012 mln
16.58%
jan 1, 1998
63.133 mln
-242.8K
-0.38%
jan 1, 1999
62.488 mln
-645.316K
-1.02%
jan 1, 2000
67.768 mln
+5.28 mln
8.45%
jan 1, 2001
59.682 mln
-8.087 mln
-11.93%
jan 1, 2002
56.995 mln
-2.686 mln
-4.5%
jan 1, 2003
63.994 mln
+6.999 mln
12.28%
jan 1, 2004
81.115 mln
+17.121 mln
26.75%
jan 1, 2005
91.375 mln
+10.26 mln
12.65%
jan 1, 2006
96.846 mln
+5.471 mln
5.99%
jan 1, 2007
99.558 mln
+2.712 mln
2.8%
jan 1, 2008
120.724 mln
+21.166 mln
21.26%
jan 1, 2009
131.868 mln
+11.144 mln
9.23%
jan 1, 2010
122.9 mln
-8.968 mln
-6.8%
jan 1, 2011
145.479 mln
+22.579 mln
18.37%
jan 1, 2012
170.025 mln
+24.546 mln
16.87%
jan 1, 2013
179.141 mln
+9.116 mln
5.36%
jan 1, 2014
180.396 mln
+1.254 mln
0.7%
Ranking of countries by current statistics by years


Comments: