29
/
en
AIzaSyAYiBZKx7MnpbEhh9jyipgxe19OcubqV5w
April 1, 2024
64794
Albania
ALB
true
2
1
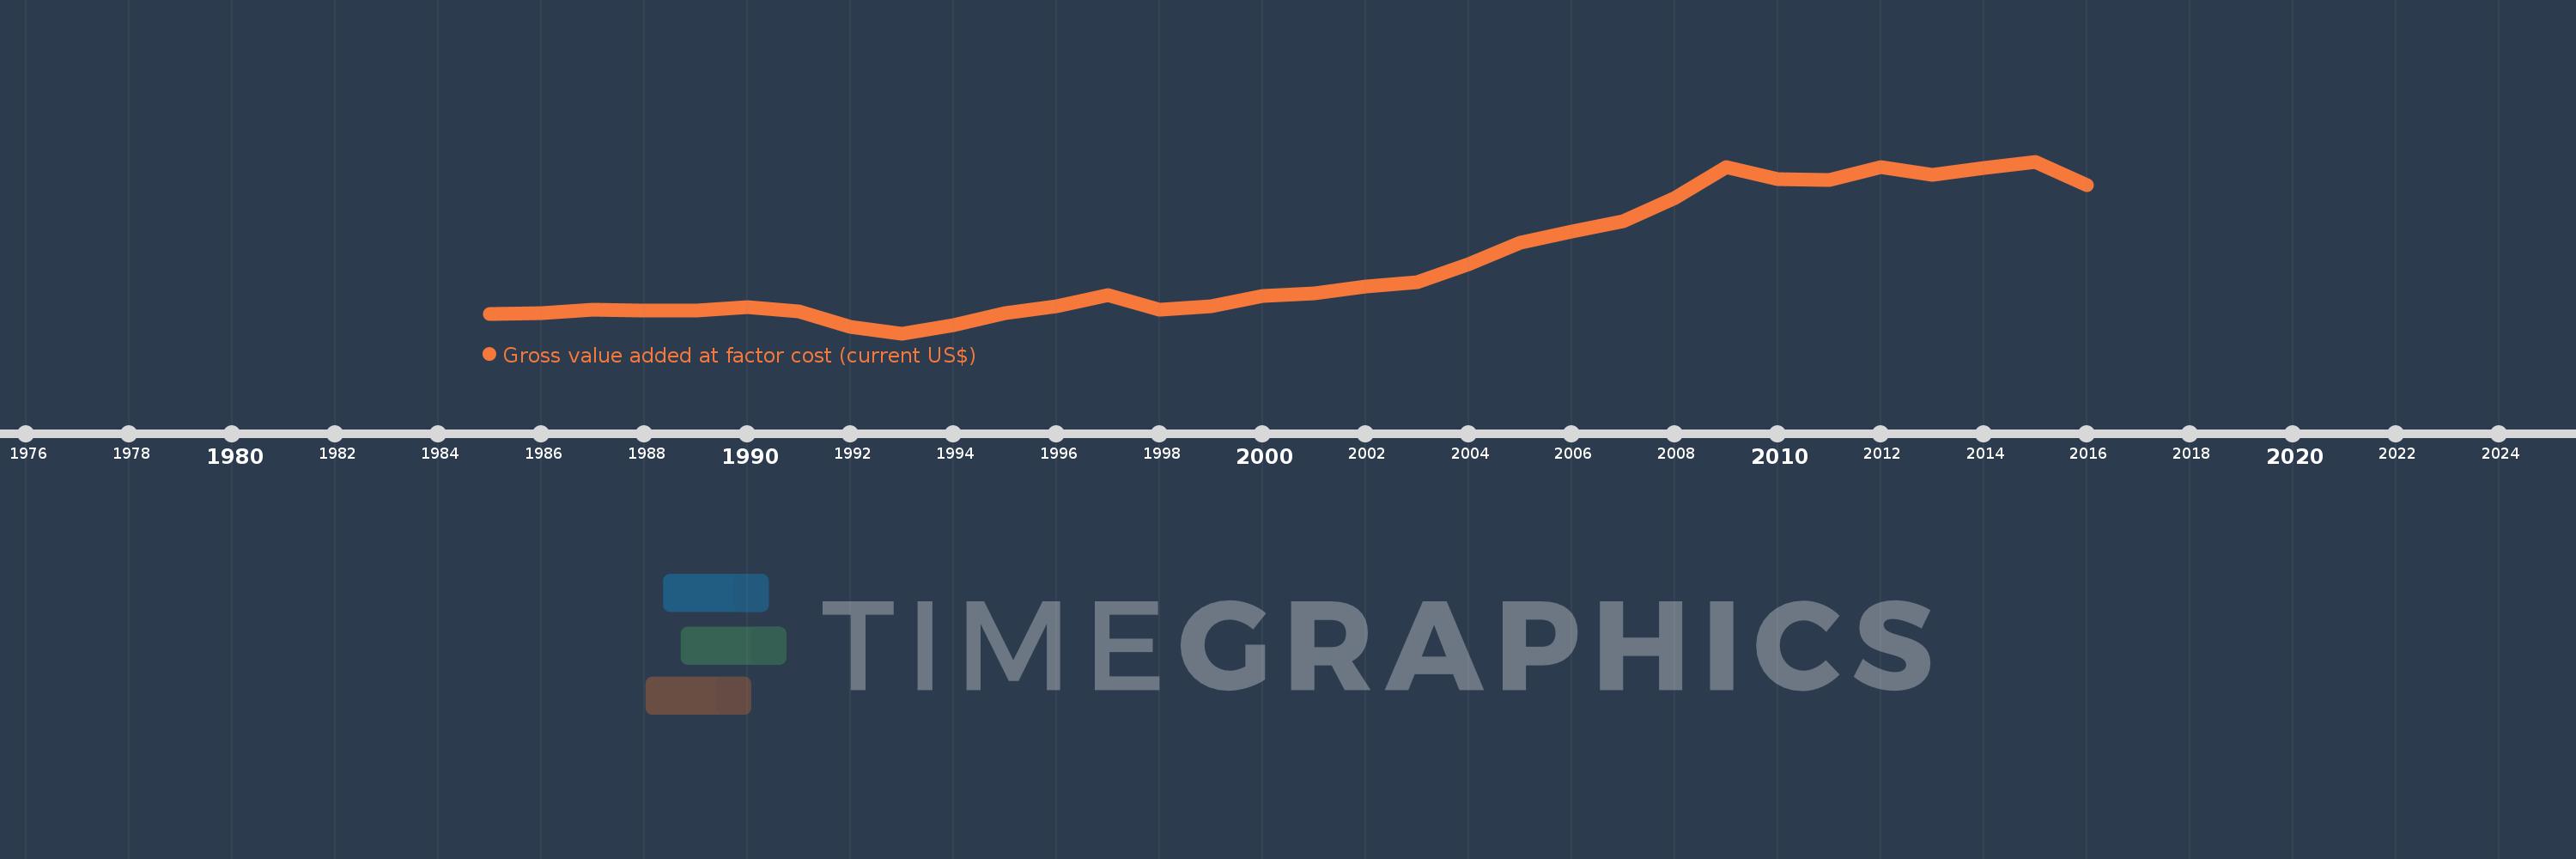
Gross value added at factor cost (current US$)
2016,2015,2014,2013,2012,2011,2010,2009,2008,2007,2006,2005,2004,2003,2002,2001,2000,1999,1998,1997,1996,1995,1994,1993,1992,1991,1990,1989,1988,1987,1986,1985
This statistics in other country:
AfghanistanAlbaniaAlgeriaAndorraAntigua and BarbudaArgentinaArmeniaArubaAustraliaAustriaAzerbaijanBahamas, TheBahrainBangladeshBarbadosBelarusBelgiumBelizeBeninBermudaBhutanBoliviaBosnia and HerzegovinaBotswanaBrazilBulgariaBurkina FasoBurundiCabo VerdeCambodiaCameroonCanadaCaribbean small statesCayman IslandsCentral African RepublicCentral Europe and the BalticsChadChileColombiaCongo, Dem. Rep.Costa RicaCroatiaCubaCyprusCzech RepublicDenmarkDjiboutiDominicaDominican RepublicEarly-demographic dividendEcuadorEgypt, Arab Rep.El SalvadorEquatorial GuineaEritreaEstoniaEthiopiaEuro areaEurope & Central AsiaEurope & Central Asia (excluding high income)Europe & Central Asia (IDA & IBRD countries)European UnionFaroe IslandsFijiFinlandFranceGabonGambia, TheGeorgiaGermanyGhanaGreeceGrenadaGuatemalaGuineaGuinea-BissauGuyanaHeavily indebted poor countries (HIPC)High incomeHondurasHong Kong SAR, ChinaHungaryIcelandIDA blendIDA onlyIDA totalIndiaIndonesiaIran, Islamic Rep.IrelandItalyJamaicaJapanJordanKazakhstanKenyaKiribatiKorea, Rep.KosovoKuwaitKyrgyz RepublicLao PDRLatin America & Caribbean Latin America & Caribbean (excluding high income)Latin America & the Caribbean (IDA & IBRD countries)LatviaLeast developed countries: UN classificationLebanonLesothoLiberiaLibyaLiechtensteinLithuaniaLow incomeLower middle incomeLuxembourgMacao SAR, ChinaMacedonia, FYRMadagascarMalawiMalaysiaMaldivesMaliMaltaMarshall IslandsMauritaniaMauritiusMexicoMicronesia, Fed. Sts.Middle East & North Africa (excluding high income)Middle East & North Africa (IDA & IBRD countries)MoldovaMongoliaMontenegroMoroccoMozambiqueNamibiaNepalNetherlandsNew ZealandNicaraguaNigeriaNorth AmericaNorwayOECD membersOmanPacific island small statesPakistanPalauPanamaPapua New GuineaParaguayPeruPolandPortugalPost-demographic dividendPre-demographic dividendRomaniaRussian FederationRwandaSao Tome and PrincipeSenegalSerbiaSeychellesSierra LeoneSingaporeSlovak RepublicSloveniaSolomon IslandsSouth AfricaSouth AsiaSouth Asia (IDA & IBRD)SpainSri LankaSt. Kitts and NevisSt. LuciaSt. Vincent and the GrenadinesSub-Saharan Africa Sub-Saharan Africa (excluding high income)Sub-Saharan Africa (IDA & IBRD countries)SudanSurinameSwazilandSwedenSwitzerlandSyrian Arab RepublicTajikistanTanzaniaThailandTimor-LesteTongaTrinidad and TobagoTunisiaTurkeyTurkmenistanTuvaluUgandaUkraineUnited KingdomUnited StatesUruguayUzbekistanVanuatuVenezuela, RBVietnamWest Bank and GazaWorldYemen, Rep.ZambiaZimbabwe Timeline:
This timeline shows a graph from 1985 to 2016 of Albania. No data until 1984. Number of actual observations by date: 32.
Source name:
World Development Indicators
Source organization:
World Bank national accounts data, and OECD National Accounts data files.
Categories, topics:
Economy & Growth
Last updated:
apr 23, 2017
Indicators value changes by year
Minimum:
709.453 mln
jan 1, 1993
Maximum:
11.537 bln
jan 1, 2015
At the date of observation
Value
Absolute change
Change from previous value
jan 1, 1985
1.924 bln
+1.924 bln
0.0%
jan 1, 1986
1.965 bln
+41.142 mln
2.14%
jan 1, 1987
2.174 bln
+208.365 mln
10.6%
jan 1, 1988
2.157 bln
-17.125 mln
-0.79%
jan 1, 1989
2.126 bln
-30.625 mln
-1.42%
jan 1, 1990
2.335 bln
+209.125 mln
9.84%
jan 1, 1991
2.102 bln
-233.5 mln
-10.0%
jan 1, 1992
1.139 bln
-962.458 mln
-45.8%
jan 1, 1993
709.453 mln
-429.714 mln
-37.72%
jan 1, 1994
1.228 bln
+518.618 mln
73.1%
jan 1, 1995
1.986 bln
+757.603 mln
61.69%
jan 1, 1996
2.424 bln
+438.825 mln
22.1%
jan 1, 1997
3.109 bln
+684.255 mln
28.22%
jan 1, 1998
2.179 bln
-930.242 mln
-29.92%
jan 1, 1999
2.405 bln
+226.322 mln
10.39%
jan 1, 2000
3.071 bln
+665.888 mln
27.69%
jan 1, 2001
3.222 bln
+151.121 mln
4.92%
jan 1, 2002
3.645 bln
+422.963 mln
13.13%
jan 1, 2003
3.953 bln
+307.98 mln
8.45%
jan 1, 2004
5.07 bln
+1.118 bln
28.28%
jan 1, 2005
6.437 bln
+1.367 bln
26.95%
jan 1, 2006
7.151 bln
+713.416 mln
11.08%
jan 1, 2007
7.795 bln
+644.678 mln
9.02%
jan 1, 2008
9.222 bln
+1.427 bln
18.31%
jan 1, 2009
11.168 bln
+1.945 bln
21.09%
jan 1, 2010
10.421 bln
-746.48 mln
-6.68%
jan 1, 2011
10.367 bln
-54.543 mln
-0.52%
jan 1, 2012
11.211 bln
+844.103 mln
8.14%
jan 1, 2013
10.674 bln
-537.017 mln
-4.79%
jan 1, 2014
11.151 bln
+476.767 mln
4.47%
jan 1, 2015
11.537 bln
+386.568 mln
3.47%
jan 1, 2016
10.044 bln
-1.493 bln
-12.94%
Ranking of countries by current statistics by years


Comments: