29
/
en
AIzaSyAYiBZKx7MnpbEhh9jyipgxe19OcubqV5w
April 1, 2024
253101
Sudan
SDN
true
2
1
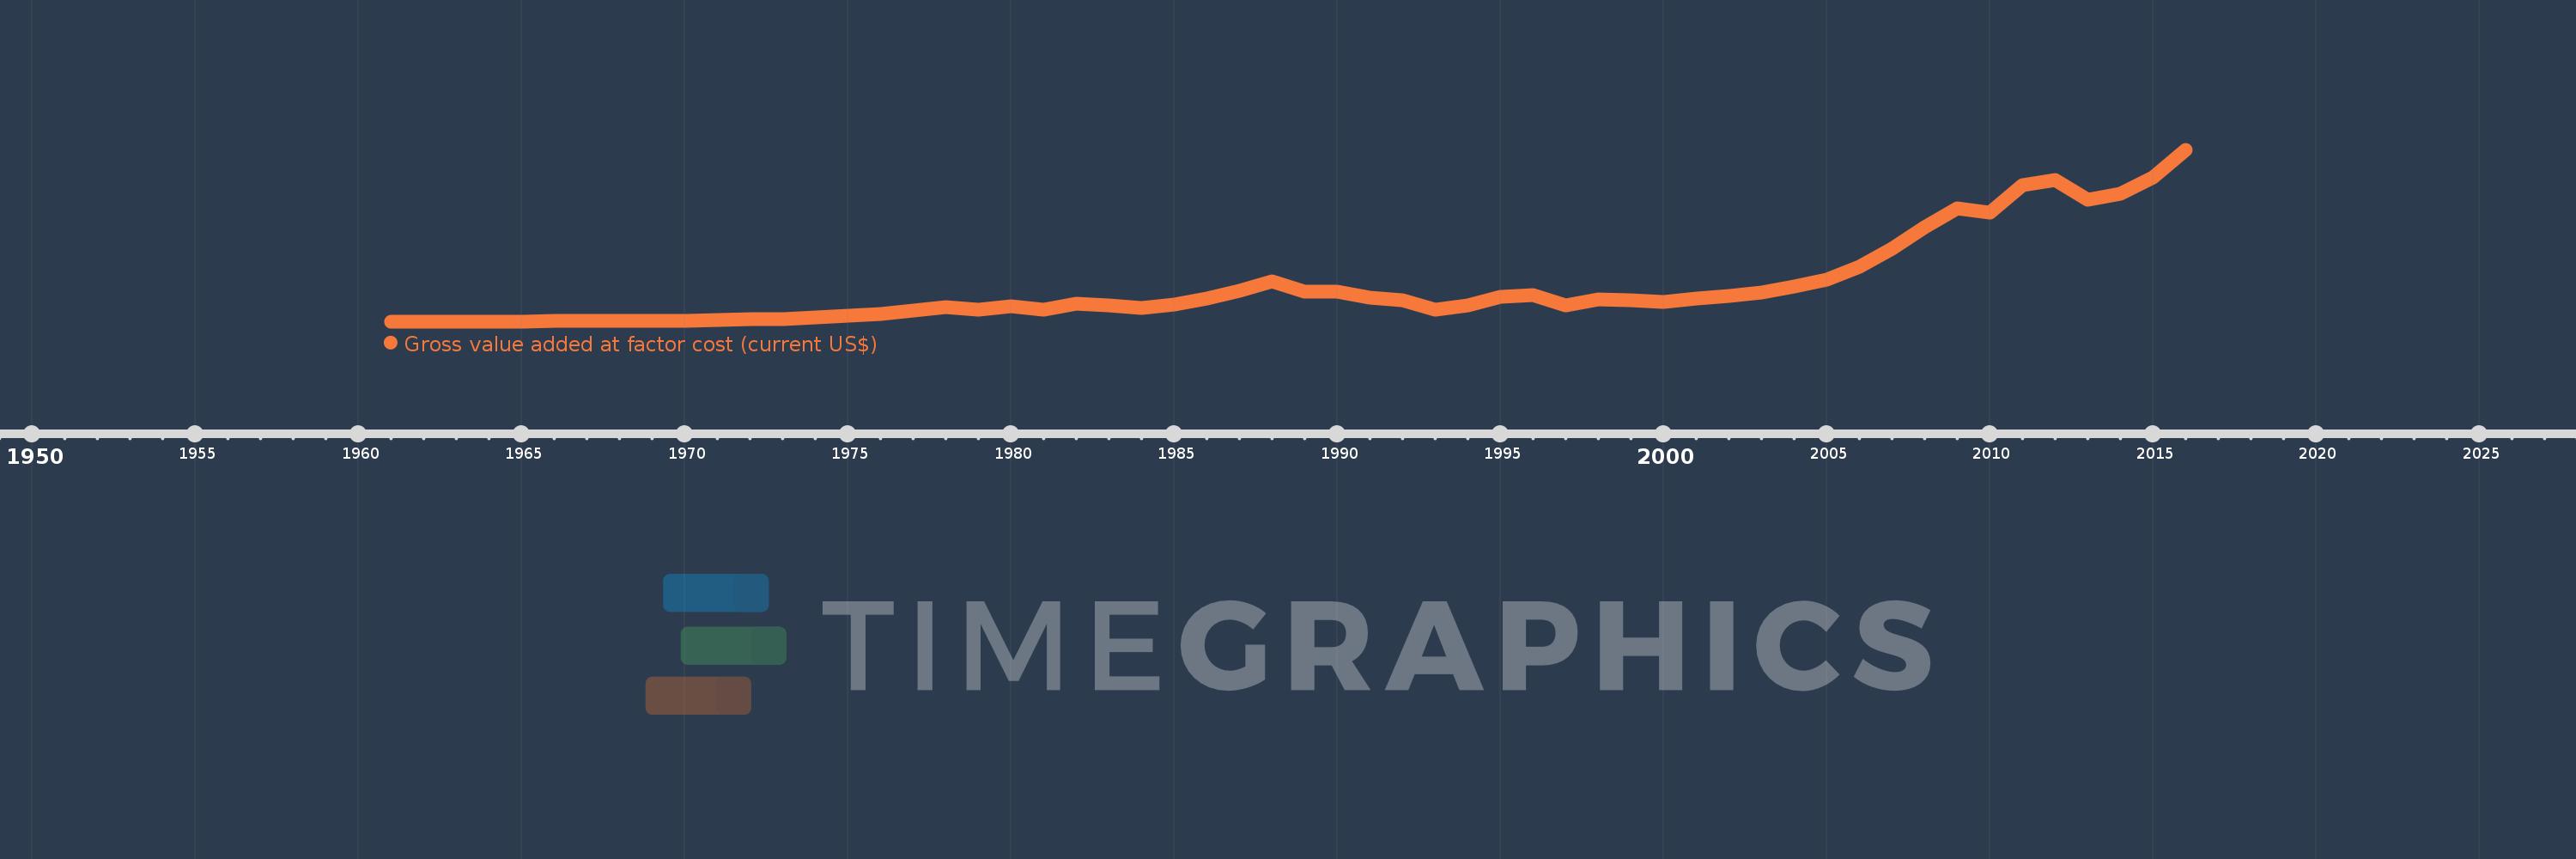
Gross value added at factor cost (current US$)
2016,2015,2014,2013,2012,2011,2010,2009,2008,2007,2006,2005,2004,2003,2002,2001,2000,1999,1998,1997,1996,1995,1994,1993,1992,1991,1990,1989,1988,1987,1986,1985,1984,1983,1982,1981,1980,1979,1978,1977,1976,1975,1974,1973,1972,1971,1970,1969,1968,1967,1966,1965,1964,1963,1962,1961
This statistics in other country:
AfghanistanAlbaniaAlgeriaAndorraAntigua and BarbudaArgentinaArmeniaArubaAustraliaAustriaAzerbaijanBahamas, TheBahrainBangladeshBarbadosBelarusBelgiumBelizeBeninBermudaBhutanBoliviaBosnia and HerzegovinaBotswanaBrazilBulgariaBurkina FasoBurundiCabo VerdeCambodiaCameroonCanadaCaribbean small statesCayman IslandsCentral African RepublicCentral Europe and the BalticsChadChileColombiaCongo, Dem. Rep.Costa RicaCroatiaCubaCyprusCzech RepublicDenmarkDjiboutiDominicaDominican RepublicEarly-demographic dividendEcuadorEgypt, Arab Rep.El SalvadorEquatorial GuineaEritreaEstoniaEthiopiaEuro areaEurope & Central AsiaEurope & Central Asia (excluding high income)Europe & Central Asia (IDA & IBRD countries)European UnionFaroe IslandsFijiFinlandFranceGabonGambia, TheGeorgiaGermanyGhanaGreeceGrenadaGuatemalaGuineaGuinea-BissauGuyanaHeavily indebted poor countries (HIPC)High incomeHondurasHong Kong SAR, ChinaHungaryIcelandIDA blendIDA onlyIDA totalIndiaIndonesiaIran, Islamic Rep.IrelandItalyJamaicaJapanJordanKazakhstanKenyaKiribatiKorea, Rep.KosovoKuwaitKyrgyz RepublicLao PDRLatin America & Caribbean Latin America & Caribbean (excluding high income)Latin America & the Caribbean (IDA & IBRD countries)LatviaLeast developed countries: UN classificationLebanonLesothoLiberiaLibyaLiechtensteinLithuaniaLow incomeLower middle incomeLuxembourgMacao SAR, ChinaMacedonia, FYRMadagascarMalawiMalaysiaMaldivesMaliMaltaMarshall IslandsMauritaniaMauritiusMexicoMicronesia, Fed. Sts.Middle East & North Africa (excluding high income)Middle East & North Africa (IDA & IBRD countries)MoldovaMongoliaMontenegroMoroccoMozambiqueNamibiaNepalNetherlandsNew ZealandNicaraguaNigeriaNorth AmericaNorwayOECD membersOmanPacific island small statesPakistanPalauPanamaPapua New GuineaParaguayPeruPolandPortugalPost-demographic dividendPre-demographic dividendRomaniaRussian FederationRwandaSao Tome and PrincipeSenegalSerbiaSeychellesSierra LeoneSingaporeSlovak RepublicSloveniaSolomon IslandsSouth AfricaSouth AsiaSouth Asia (IDA & IBRD)SpainSri LankaSt. Kitts and NevisSt. LuciaSt. Vincent and the GrenadinesSub-Saharan Africa Sub-Saharan Africa (excluding high income)Sub-Saharan Africa (IDA & IBRD countries)SudanSurinameSwazilandSwedenSwitzerlandSyrian Arab RepublicTajikistanTanzaniaThailandTimor-LesteTongaTrinidad and TobagoTunisiaTurkeyTurkmenistanTuvaluUgandaUkraineUnited KingdomUnited StatesUruguayUzbekistanVanuatuVenezuela, RBVietnamWest Bank and GazaWorldYemen, Rep.ZambiaZimbabwe Timeline:
This timeline shows a graph from 1961 to 2016 of Sudan. No data until 1960. Number of actual observations by date: 56.
Source name:
World Development Indicators
Source organization:
World Bank national accounts data, and OECD National Accounts data files.
Categories, topics:
Economy & Growth
Last updated:
apr 23, 2017
Indicators value changes by year
Minimum:
1.215 bln
jan 1, 1961
Maximum:
77.623 bln
jan 1, 2016
At the date of observation
Value
Absolute change
Change from previous value
jan 1, 1961
1.215 bln
+1.215 bln
0.0%
jan 1, 1962
1.306 bln
+91.0 mln
7.49%
jan 1, 1963
1.397 bln
+91.667 mln
7.02%
jan 1, 1964
1.416 bln
+19.0 mln
1.36%
jan 1, 1965
1.464 bln
+47.333 mln
3.34%
jan 1, 1966
1.532 bln
+68.0 mln
4.65%
jan 1, 1967
1.578 bln
+46.333 mln
3.03%
jan 1, 1968
1.695 bln
+117.0 mln
7.41%
jan 1, 1969
1.722 bln
+26.667 mln
1.57%
jan 1, 1970
1.867 bln
+145.333 mln
8.44%
jan 1, 1971
2.133 bln
+265.667 mln
14.23%
jan 1, 1972
2.313 bln
+180.333 mln
8.46%
jan 1, 1973
2.515 bln
+202.0 mln
8.73%
jan 1, 1974
3.17 bln
+655.333 mln
26.06%
jan 1, 1975
4.096 bln
+926.0 mln
29.21%
jan 1, 1976
4.941 bln
+844.333 mln
20.61%
jan 1, 1977
6.177 bln
+1.237 bln
25.03%
jan 1, 1978
7.769 bln
+1.592 bln
25.77%
jan 1, 1979
6.842 bln
-927.25 mln
-11.94%
jan 1, 1980
8.158 bln
+1.316 bln
19.23%
jan 1, 1981
6.791 bln
-1.366 bln
-16.75%
jan 1, 1982
9.194 bln
+2.403 bln
35.38%
jan 1, 1983
8.539 bln
-654.722 mln
-7.12%
jan 1, 1984
7.612 bln
-927.752 mln
-10.86%
jan 1, 1985
9.025 bln
+1.414 bln
18.57%
jan 1, 1986
11.637 bln
+2.611 bln
28.93%
jan 1, 1987
15.015 bln
+3.378 bln
29.03%
jan 1, 1988
19.417 bln
+4.402 bln
29.32%
jan 1, 1989
14.602 bln
-4.815 bln
-24.8%
jan 1, 1990
14.589 bln
-13.929 mln
-0.1%
jan 1, 1991
11.932 bln
-2.656 bln
-18.21%
jan 1, 1992
10.945 bln
-987.581 mln
-8.28%
jan 1, 1993
6.733 bln
-4.212 bln
-38.49%
jan 1, 1994
8.565 bln
+1.833 bln
27.22%
jan 1, 1995
12.364 bln
+3.799 bln
44.36%
jan 1, 1996
13.331 bln
+966.923 mln
7.82%
jan 1, 1997
8.734 bln
-4.597 bln
-34.48%
jan 1, 1998
11.242 bln
+2.508 bln
28.71%
jan 1, 1999
10.776 bln
-466.231 mln
-4.15%
jan 1, 2000
10.219 bln
-557.323 mln
-5.17%
jan 1, 2001
11.825 bln
+1.606 bln
15.72%
jan 1, 2002
12.677 bln
+851.941 mln
7.2%
jan 1, 2003
14.228 bln
+1.551 bln
12.23%
jan 1, 2004
16.892 bln
+2.664 bln
18.73%
jan 1, 2005
19.993 bln
+3.101 bln
18.36%
jan 1, 2006
25.743 bln
+5.75 bln
28.76%
jan 1, 2007
33.792 bln
+8.048 bln
31.26%
jan 1, 2008
43.315 bln
+9.524 bln
28.18%
jan 1, 2009
51.794 bln
+8.478 bln
19.57%
jan 1, 2010
49.929 bln
-1.865 bln
-3.6%
jan 1, 2011
62.159 bln
+12.23 bln
24.5%
jan 1, 2012
64.471 bln
+2.312 bln
3.72%
jan 1, 2013
55.571 bln
-8.9 bln
-13.8%
jan 1, 2014
58.31 bln
+2.739 bln
4.93%
jan 1, 2015
65.587 bln
+7.277 bln
12.48%
jan 1, 2016
77.623 bln
+12.036 bln
18.35%
Ranking of countries by current statistics by years


Comments: