29
/
en
AIzaSyAYiBZKx7MnpbEhh9jyipgxe19OcubqV5w
April 1, 2024
86024
Bhutan
BTN
true
2
1
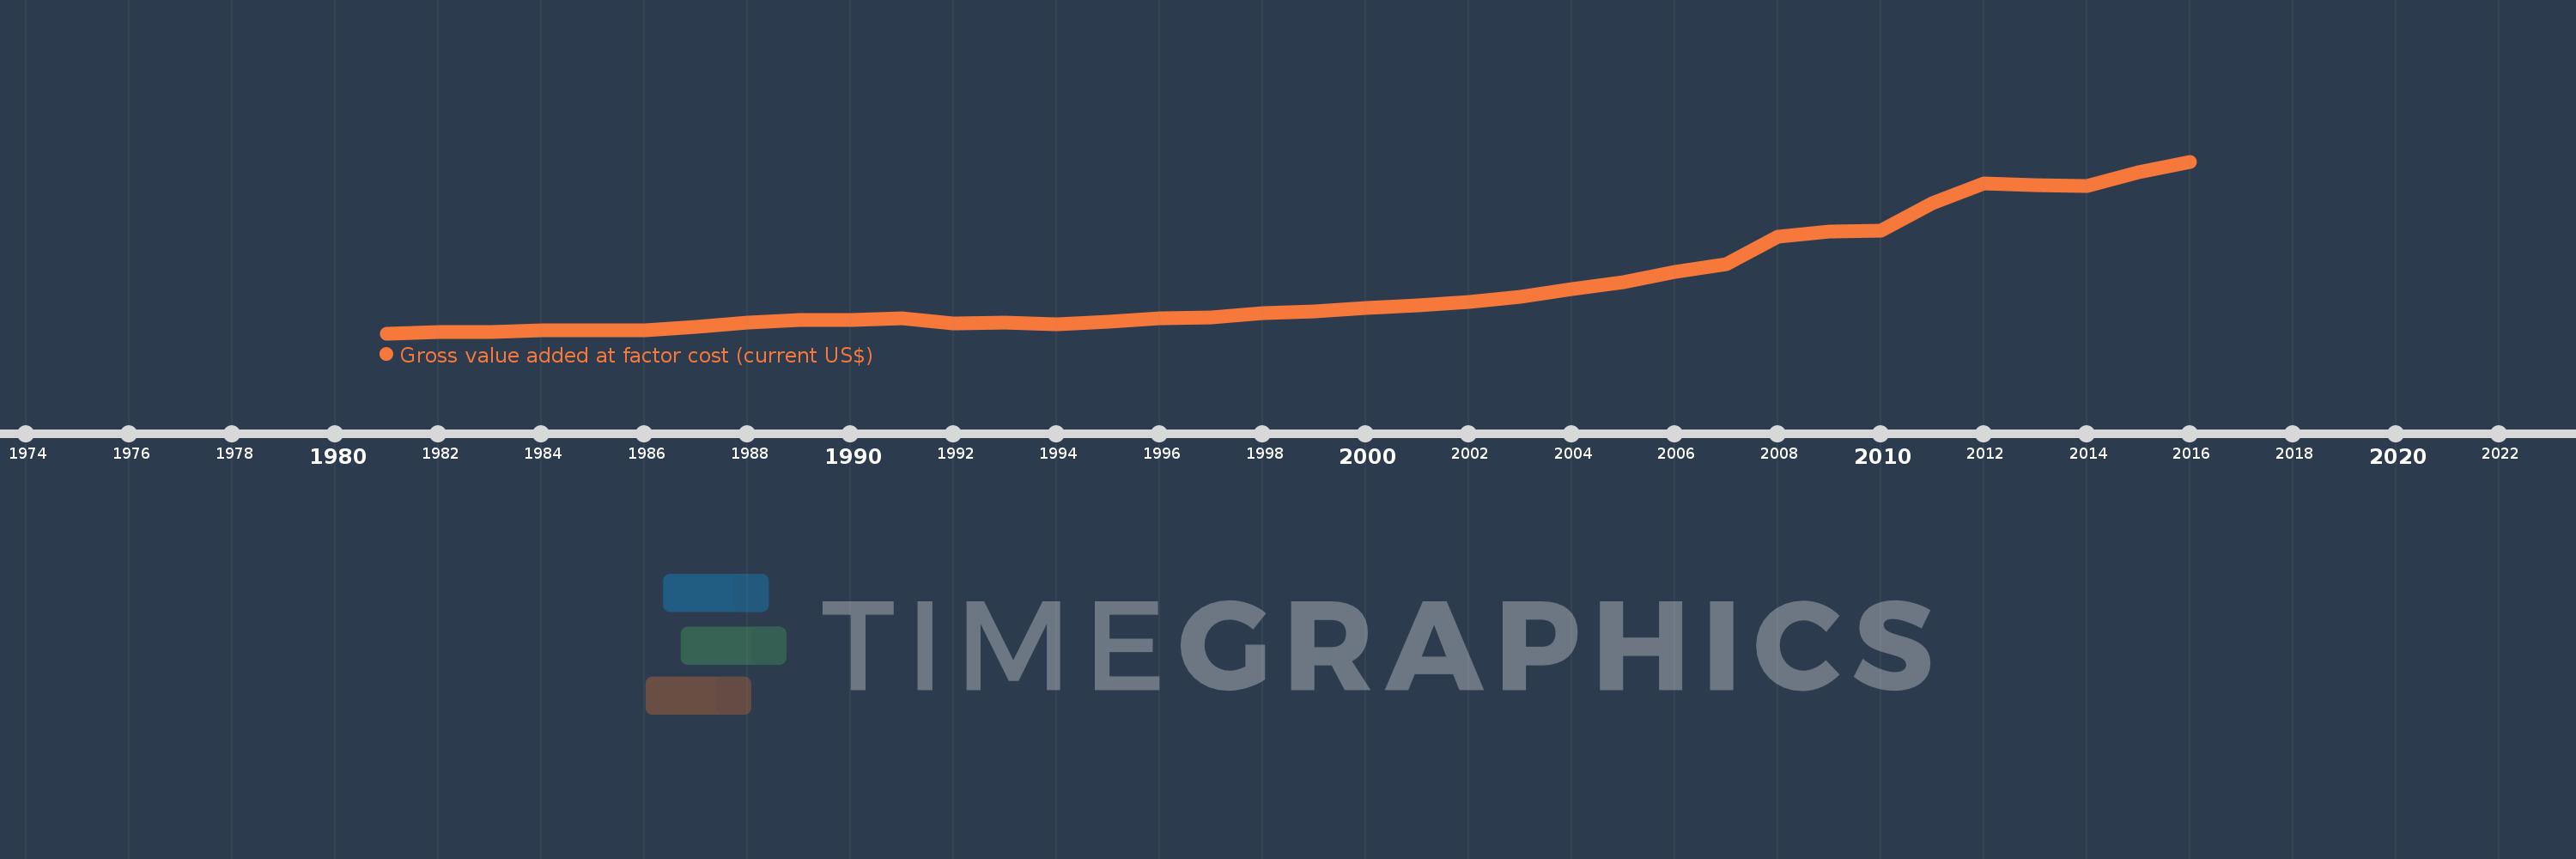
Gross value added at factor cost (current US$)
2016,2015,2014,2013,2012,2011,2010,2009,2008,2007,2006,2005,2004,2003,2002,2001,2000,1999,1998,1997,1996,1995,1994,1993,1992,1991,1990,1989,1988,1987,1986,1985,1984,1983,1982,1981
This statistics in other country:
AfghanistanAlbaniaAlgeriaAndorraAntigua and BarbudaArgentinaArmeniaArubaAustraliaAustriaAzerbaijanBahamas, TheBahrainBangladeshBarbadosBelarusBelgiumBelizeBeninBermudaBhutanBoliviaBosnia and HerzegovinaBotswanaBrazilBulgariaBurkina FasoBurundiCabo VerdeCambodiaCameroonCanadaCaribbean small statesCayman IslandsCentral African RepublicCentral Europe and the BalticsChadChileColombiaCongo, Dem. Rep.Costa RicaCroatiaCubaCyprusCzech RepublicDenmarkDjiboutiDominicaDominican RepublicEarly-demographic dividendEcuadorEgypt, Arab Rep.El SalvadorEquatorial GuineaEritreaEstoniaEthiopiaEuro areaEurope & Central AsiaEurope & Central Asia (excluding high income)Europe & Central Asia (IDA & IBRD countries)European UnionFaroe IslandsFijiFinlandFranceGabonGambia, TheGeorgiaGermanyGhanaGreeceGrenadaGuatemalaGuineaGuinea-BissauGuyanaHeavily indebted poor countries (HIPC)High incomeHondurasHong Kong SAR, ChinaHungaryIcelandIDA blendIDA onlyIDA totalIndiaIndonesiaIran, Islamic Rep.IrelandItalyJamaicaJapanJordanKazakhstanKenyaKiribatiKorea, Rep.KosovoKuwaitKyrgyz RepublicLao PDRLatin America & Caribbean Latin America & Caribbean (excluding high income)Latin America & the Caribbean (IDA & IBRD countries)LatviaLeast developed countries: UN classificationLebanonLesothoLiberiaLibyaLiechtensteinLithuaniaLow incomeLower middle incomeLuxembourgMacao SAR, ChinaMacedonia, FYRMadagascarMalawiMalaysiaMaldivesMaliMaltaMarshall IslandsMauritaniaMauritiusMexicoMicronesia, Fed. Sts.Middle East & North Africa (excluding high income)Middle East & North Africa (IDA & IBRD countries)MoldovaMongoliaMontenegroMoroccoMozambiqueNamibiaNepalNetherlandsNew ZealandNicaraguaNigeriaNorth AmericaNorwayOECD membersOmanPacific island small statesPakistanPalauPanamaPapua New GuineaParaguayPeruPolandPortugalPost-demographic dividendPre-demographic dividendRomaniaRussian FederationRwandaSao Tome and PrincipeSenegalSerbiaSeychellesSierra LeoneSingaporeSlovak RepublicSloveniaSolomon IslandsSouth AfricaSouth AsiaSouth Asia (IDA & IBRD)SpainSri LankaSt. Kitts and NevisSt. LuciaSt. Vincent and the GrenadinesSub-Saharan Africa Sub-Saharan Africa (excluding high income)Sub-Saharan Africa (IDA & IBRD countries)SudanSurinameSwazilandSwedenSwitzerlandSyrian Arab RepublicTajikistanTanzaniaThailandTimor-LesteTongaTrinidad and TobagoTunisiaTurkeyTurkmenistanTuvaluUgandaUkraineUnited KingdomUnited StatesUruguayUzbekistanVanuatuVenezuela, RBVietnamWest Bank and GazaWorldYemen, Rep.ZambiaZimbabwe Timeline:
This timeline shows a graph from 1981 to 2016 of Bhutan. No data until 1980. Number of actual observations by date: 36.
Source name:
World Development Indicators
Source organization:
World Bank national accounts data, and OECD National Accounts data files.
Categories, topics:
Economy & Growth
Last updated:
apr 23, 2017
Indicators value changes by year
Minimum:
133.376 mln
jan 1, 1981
Maximum:
1.969 bln
jan 1, 2016
At the date of observation
Value
Absolute change
Change from previous value
jan 1, 1981
133.376 mln
+133.376 mln
0.0%
jan 1, 1982
143.944 mln
+10.568 mln
7.92%
jan 1, 1983
146.44 mln
+2.496 mln
1.73%
jan 1, 1984
162.14 mln
+15.701 mln
10.72%
jan 1, 1985
165.251 mln
+3.111 mln
1.92%
jan 1, 1986
168.838 mln
+3.587 mln
2.17%
jan 1, 1987
197.966 mln
+29.127 mln
17.25%
jan 1, 1988
247.264 mln
+49.299 mln
24.9%
jan 1, 1989
277.908 mln
+30.643 mln
12.39%
jan 1, 1990
271.409 mln
-6.499 mln
-2.34%
jan 1, 1991
292.135 mln
+20.726 mln
7.64%
jan 1, 1992
243.054 mln
-49.081 mln
-16.8%
jan 1, 1993
244.004 mln
+950.481K
0.39%
jan 1, 1994
229.172 mln
-14.832 mln
-6.08%
jan 1, 1995
259.613 mln
+30.441 mln
13.28%
jan 1, 1996
292.014 mln
+32.402 mln
12.48%
jan 1, 1997
306.288 mln
+14.274 mln
4.89%
jan 1, 1998
352.029 mln
+45.741 mln
14.93%
jan 1, 1999
363.722 mln
+11.693 mln
3.32%
jan 1, 2000
404.614 mln
+40.892 mln
11.24%
jan 1, 2001
429.727 mln
+25.113 mln
6.21%
jan 1, 2002
466.184 mln
+36.457 mln
8.48%
jan 1, 2003
520.282 mln
+54.098 mln
11.6%
jan 1, 2004
602.266 mln
+81.984 mln
15.76%
jan 1, 2005
675.955 mln
+73.689 mln
12.24%
jan 1, 2006
788.985 mln
+113.03 mln
16.72%
jan 1, 2007
868.209 mln
+79.224 mln
10.04%
jan 1, 2008
1.161 bln
+292.996 mln
33.75%
jan 1, 2009
1.221 bln
+60.049 mln
5.17%
jan 1, 2010
1.23 bln
+8.284 mln
0.68%
jan 1, 2011
1.522 bln
+292.614 mln
23.8%
jan 1, 2012
1.736 bln
+214.021 mln
14.06%
jan 1, 2013
1.715 bln
-21.263 mln
-1.22%
jan 1, 2014
1.705 bln
-10.357 mln
-0.6%
jan 1, 2015
1.852 bln
+147.503 mln
8.65%
jan 1, 2016
1.969 bln
+116.584 mln
6.29%
Ranking of countries by current statistics by years


Comments: