29
/
en
AIzaSyAYiBZKx7MnpbEhh9jyipgxe19OcubqV5w
April 1, 2024
71222
Armenia
ARM
true
2
1
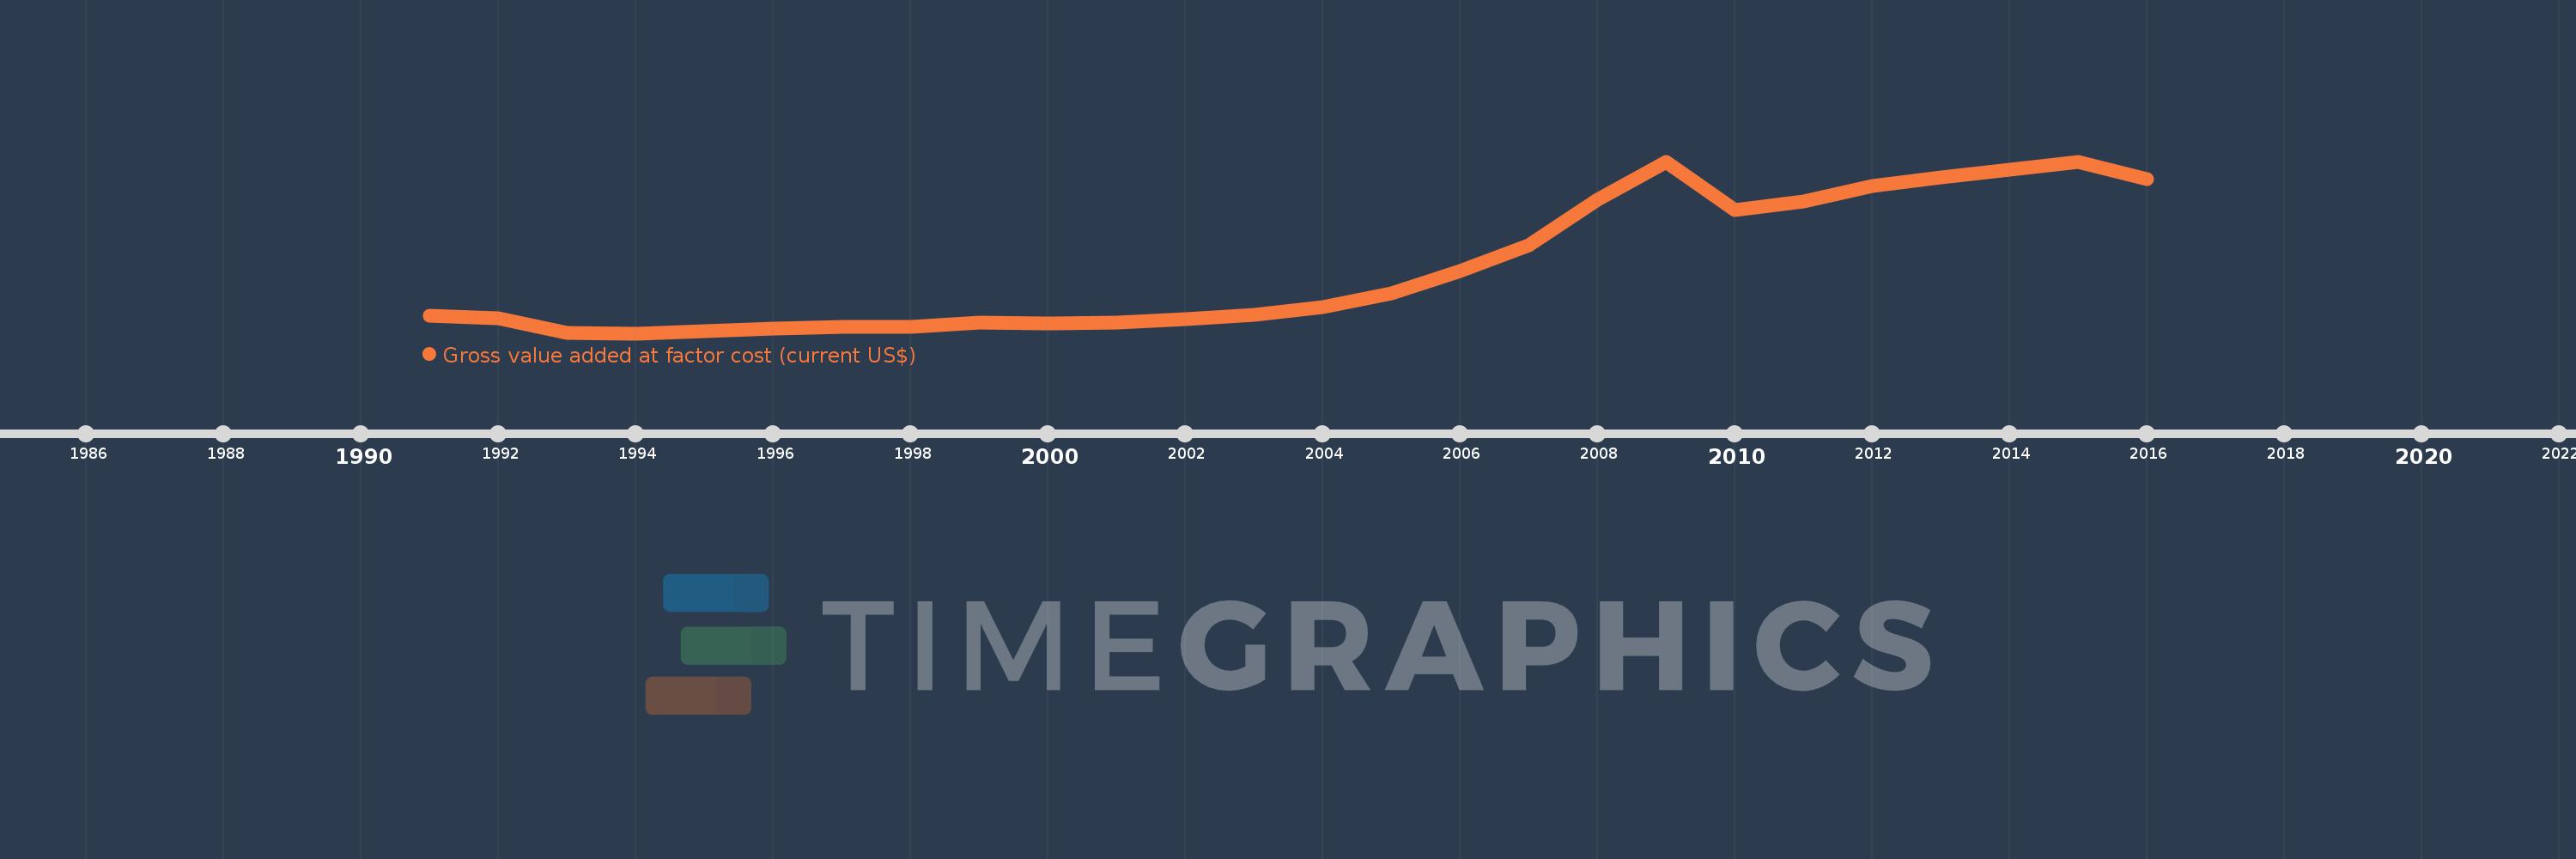
Gross value added at factor cost (current US$)
2016,2015,2014,2013,2012,2011,2010,2009,2008,2007,2006,2005,2004,2003,2002,2001,2000,1999,1998,1997,1996,1995,1994,1993,1992,1991
This statistics in other country:
AfghanistanAlbaniaAlgeriaAndorraAntigua and BarbudaArgentinaArmeniaArubaAustraliaAustriaAzerbaijanBahamas, TheBahrainBangladeshBarbadosBelarusBelgiumBelizeBeninBermudaBhutanBoliviaBosnia and HerzegovinaBotswanaBrazilBulgariaBurkina FasoBurundiCabo VerdeCambodiaCameroonCanadaCaribbean small statesCayman IslandsCentral African RepublicCentral Europe and the BalticsChadChileColombiaCongo, Dem. Rep.Costa RicaCroatiaCubaCyprusCzech RepublicDenmarkDjiboutiDominicaDominican RepublicEarly-demographic dividendEcuadorEgypt, Arab Rep.El SalvadorEquatorial GuineaEritreaEstoniaEthiopiaEuro areaEurope & Central AsiaEurope & Central Asia (excluding high income)Europe & Central Asia (IDA & IBRD countries)European UnionFaroe IslandsFijiFinlandFranceGabonGambia, TheGeorgiaGermanyGhanaGreeceGrenadaGuatemalaGuineaGuinea-BissauGuyanaHeavily indebted poor countries (HIPC)High incomeHondurasHong Kong SAR, ChinaHungaryIcelandIDA blendIDA onlyIDA totalIndiaIndonesiaIran, Islamic Rep.IrelandItalyJamaicaJapanJordanKazakhstanKenyaKiribatiKorea, Rep.KosovoKuwaitKyrgyz RepublicLao PDRLatin America & Caribbean Latin America & Caribbean (excluding high income)Latin America & the Caribbean (IDA & IBRD countries)LatviaLeast developed countries: UN classificationLebanonLesothoLiberiaLibyaLiechtensteinLithuaniaLow incomeLower middle incomeLuxembourgMacao SAR, ChinaMacedonia, FYRMadagascarMalawiMalaysiaMaldivesMaliMaltaMarshall IslandsMauritaniaMauritiusMexicoMicronesia, Fed. Sts.Middle East & North Africa (excluding high income)Middle East & North Africa (IDA & IBRD countries)MoldovaMongoliaMontenegroMoroccoMozambiqueNamibiaNepalNetherlandsNew ZealandNicaraguaNigeriaNorth AmericaNorwayOECD membersOmanPacific island small statesPakistanPalauPanamaPapua New GuineaParaguayPeruPolandPortugalPost-demographic dividendPre-demographic dividendRomaniaRussian FederationRwandaSao Tome and PrincipeSenegalSerbiaSeychellesSierra LeoneSingaporeSlovak RepublicSloveniaSolomon IslandsSouth AfricaSouth AsiaSouth Asia (IDA & IBRD)SpainSri LankaSt. Kitts and NevisSt. LuciaSt. Vincent and the GrenadinesSub-Saharan Africa Sub-Saharan Africa (excluding high income)Sub-Saharan Africa (IDA & IBRD countries)SudanSurinameSwazilandSwedenSwitzerlandSyrian Arab RepublicTajikistanTanzaniaThailandTimor-LesteTongaTrinidad and TobagoTunisiaTurkeyTurkmenistanTuvaluUgandaUkraineUnited KingdomUnited StatesUruguayUzbekistanVanuatuVenezuela, RBVietnamWest Bank and GazaWorldYemen, Rep.ZambiaZimbabwe Timeline:
This timeline shows a graph from 1991 to 2016 of Armenia. No data until 1990. Number of actual observations by date: 26.
Source name:
World Development Indicators
Source organization:
World Bank national accounts data, and OECD National Accounts data files.
Categories, topics:
Economy & Growth
Last updated:
apr 23, 2017
Indicators value changes by year
Minimum:
1.152 bln
jan 1, 1994
Maximum:
10.337 bln
jan 1, 2009
At the date of observation
Value
Absolute change
Change from previous value
jan 1, 1991
2.076 bln
+2.076 bln
0.0%
jan 1, 1992
1.956 bln
-119.478 mln
-5.76%
jan 1, 1993
1.168 bln
-788.375 mln
-40.3%
jan 1, 1994
1.152 bln
-15.787 mln
-1.35%
jan 1, 1995
1.274 bln
+121.92 mln
10.58%
jan 1, 1996
1.414 bln
+140.062 mln
10.99%
jan 1, 1997
1.509 bln
+94.946 mln
6.71%
jan 1, 1998
1.508 bln
-459.08K
-0.03%
jan 1, 1999
1.718 bln
+209.902 mln
13.92%
jan 1, 2000
1.689 bln
-29.754 mln
-1.73%
jan 1, 2001
1.737 bln
+48.311 mln
2.86%
jan 1, 2002
1.914 bln
+176.802 mln
10.18%
jan 1, 2003
2.146 bln
+232.628 mln
12.16%
jan 1, 2004
2.552 bln
+405.529 mln
18.89%
jan 1, 2005
3.277 bln
+725.04 mln
28.41%
jan 1, 2006
4.479 bln
+1.202 bln
36.69%
jan 1, 2007
5.843 bln
+1.364 bln
30.44%
jan 1, 2008
8.284 bln
+2.441 bln
41.78%
jan 1, 2009
10.337 bln
+2.054 bln
24.79%
jan 1, 2010
7.733 bln
-2.605 bln
-25.2%
jan 1, 2011
8.219 bln
+486.372 mln
6.29%
jan 1, 2012
9.035 bln
+816.307 mln
9.93%
jan 1, 2013
9.479 bln
+443.56 mln
4.91%
jan 1, 2014
9.885 bln
+406.382 mln
4.29%
jan 1, 2015
10.296 bln
+410.808 mln
4.16%
jan 1, 2016
9.408 bln
-887.667 mln
-8.62%
Ranking of countries by current statistics by years


Comments: