29
/
en
AIzaSyAYiBZKx7MnpbEhh9jyipgxe19OcubqV5w
April 1, 2024
166229
Kazakhstan
KAZ
true
2
1
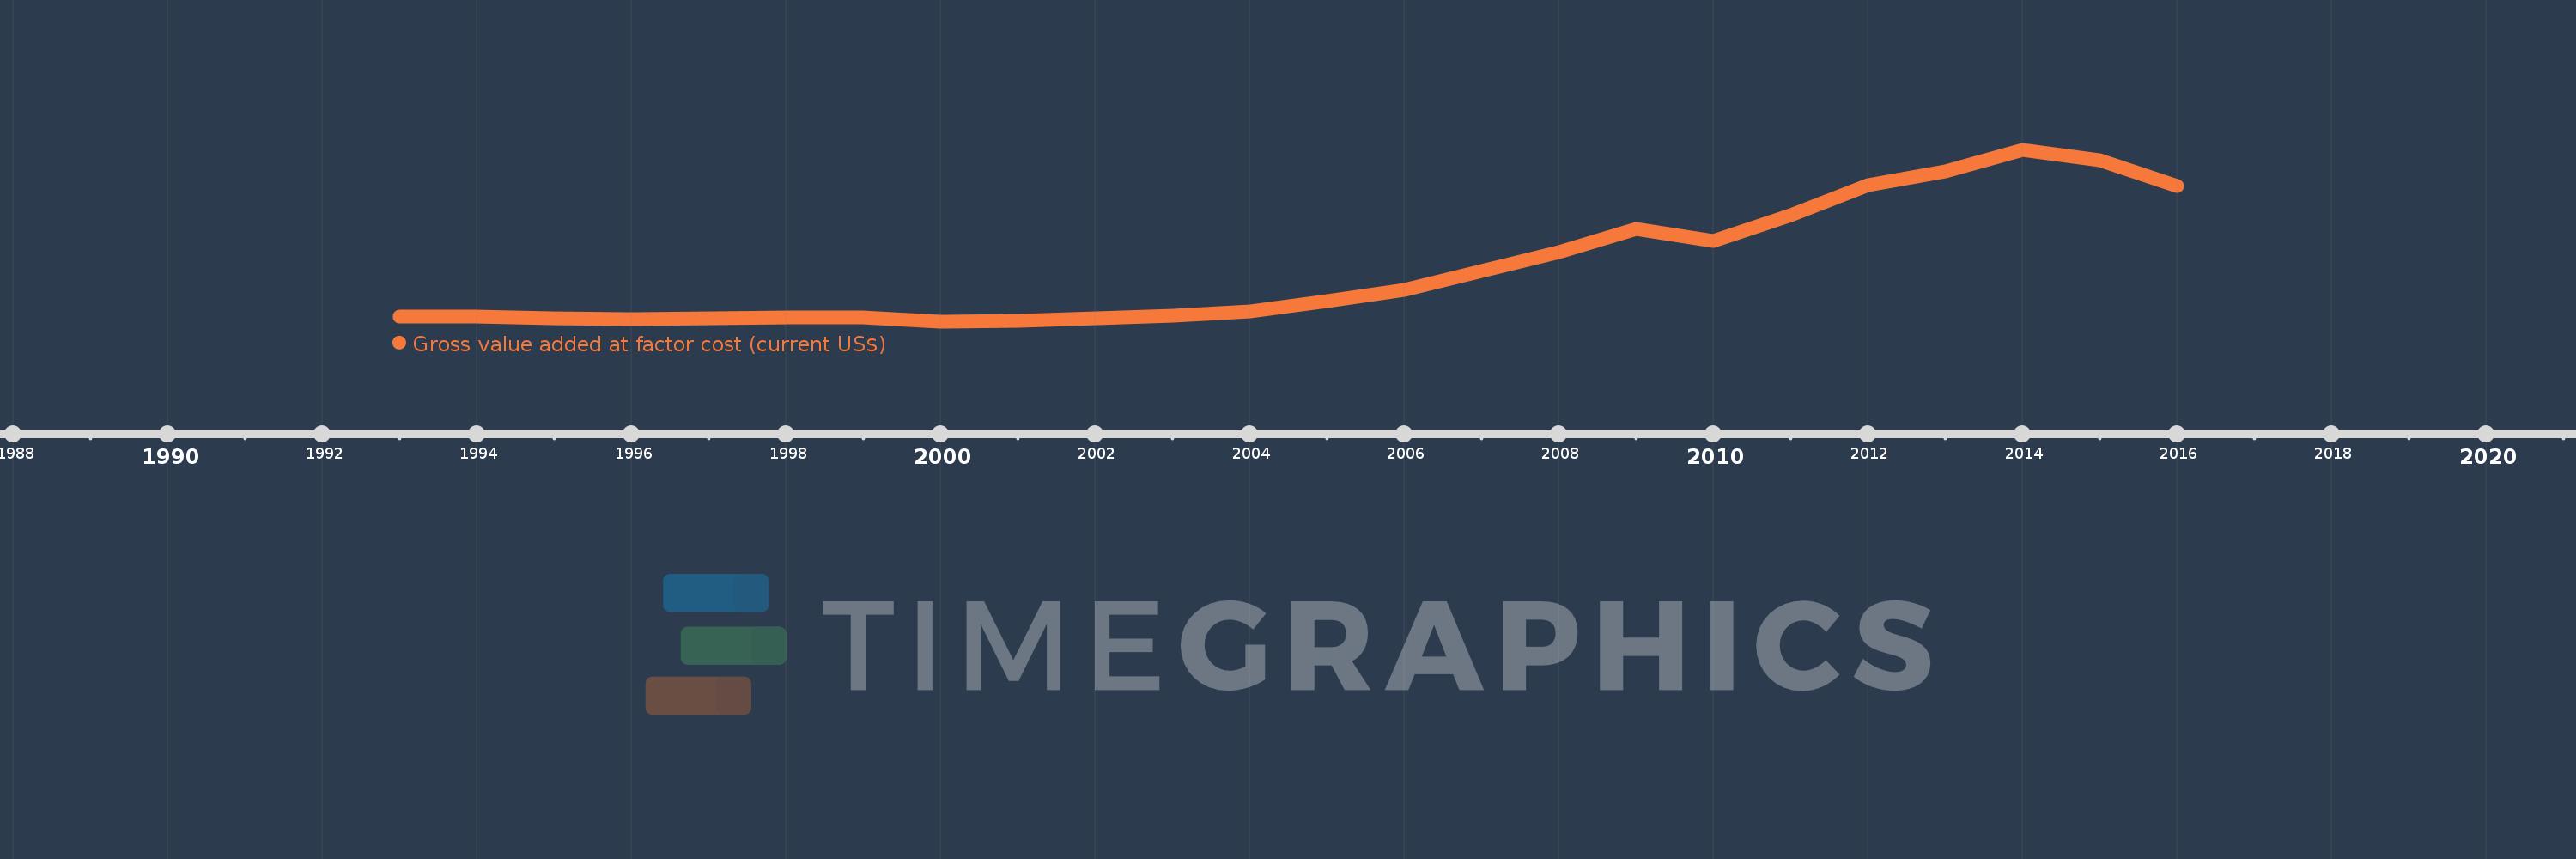
Gross value added at factor cost (current US$)
2016,2015,2014,2013,2012,2011,2010,2009,2008,2007,2006,2005,2004,2003,2002,2001,2000,1999,1998,1997,1996,1995,1994,1993
This statistics in other country:
AfghanistanAlbaniaAlgeriaAndorraAntigua and BarbudaArgentinaArmeniaArubaAustraliaAustriaAzerbaijanBahamas, TheBahrainBangladeshBarbadosBelarusBelgiumBelizeBeninBermudaBhutanBoliviaBosnia and HerzegovinaBotswanaBrazilBulgariaBurkina FasoBurundiCabo VerdeCambodiaCameroonCanadaCaribbean small statesCayman IslandsCentral African RepublicCentral Europe and the BalticsChadChileColombiaCongo, Dem. Rep.Costa RicaCroatiaCubaCyprusCzech RepublicDenmarkDjiboutiDominicaDominican RepublicEarly-demographic dividendEcuadorEgypt, Arab Rep.El SalvadorEquatorial GuineaEritreaEstoniaEthiopiaEuro areaEurope & Central AsiaEurope & Central Asia (excluding high income)Europe & Central Asia (IDA & IBRD countries)European UnionFaroe IslandsFijiFinlandFranceGabonGambia, TheGeorgiaGermanyGhanaGreeceGrenadaGuatemalaGuineaGuinea-BissauGuyanaHeavily indebted poor countries (HIPC)High incomeHondurasHong Kong SAR, ChinaHungaryIcelandIDA blendIDA onlyIDA totalIndiaIndonesiaIran, Islamic Rep.IrelandItalyJamaicaJapanJordanKazakhstanKenyaKiribatiKorea, Rep.KosovoKuwaitKyrgyz RepublicLao PDRLatin America & Caribbean Latin America & Caribbean (excluding high income)Latin America & the Caribbean (IDA & IBRD countries)LatviaLeast developed countries: UN classificationLebanonLesothoLiberiaLibyaLiechtensteinLithuaniaLow incomeLower middle incomeLuxembourgMacao SAR, ChinaMacedonia, FYRMadagascarMalawiMalaysiaMaldivesMaliMaltaMarshall IslandsMauritaniaMauritiusMexicoMicronesia, Fed. Sts.Middle East & North Africa (excluding high income)Middle East & North Africa (IDA & IBRD countries)MoldovaMongoliaMontenegroMoroccoMozambiqueNamibiaNepalNetherlandsNew ZealandNicaraguaNigeriaNorth AmericaNorwayOECD membersOmanPacific island small statesPakistanPalauPanamaPapua New GuineaParaguayPeruPolandPortugalPost-demographic dividendPre-demographic dividendRomaniaRussian FederationRwandaSao Tome and PrincipeSenegalSerbiaSeychellesSierra LeoneSingaporeSlovak RepublicSloveniaSolomon IslandsSouth AfricaSouth AsiaSouth Asia (IDA & IBRD)SpainSri LankaSt. Kitts and NevisSt. LuciaSt. Vincent and the GrenadinesSub-Saharan Africa Sub-Saharan Africa (excluding high income)Sub-Saharan Africa (IDA & IBRD countries)SudanSurinameSwazilandSwedenSwitzerlandSyrian Arab RepublicTajikistanTanzaniaThailandTimor-LesteTongaTrinidad and TobagoTunisiaTurkeyTurkmenistanTuvaluUgandaUkraineUnited KingdomUnited StatesUruguayUzbekistanVanuatuVenezuela, RBVietnamWest Bank and GazaWorldYemen, Rep.ZambiaZimbabwe Timeline:
This timeline shows a graph from 1993 to 2016 of Kazakhstan. No data until 1992. Number of actual observations by date: 24.
Source name:
World Development Indicators
Source organization:
World Bank national accounts data, and OECD National Accounts data files.
Categories, topics:
Economy & Growth
Last updated:
apr 23, 2017
Indicators value changes by year
Minimum:
15.921 bln
jan 1, 2000
Maximum:
216.241 bln
jan 1, 2014
At the date of observation
Value
Absolute change
Change from previous value
jan 1, 1993
21.768 bln
+21.768 bln
0.0%
jan 1, 1994
21.979 bln
+211.657 mln
0.97%
jan 1, 1995
20.556 bln
-1.423 bln
-6.47%
jan 1, 1996
19.484 bln
-1.073 bln
-5.22%
jan 1, 1997
19.989 bln
+505.542 mln
2.59%
jan 1, 1998
21.147 bln
+1.158 bln
5.79%
jan 1, 1999
20.811 bln
-335.463 mln
-1.59%
jan 1, 2000
15.921 bln
-4.89 bln
-23.5%
jan 1, 2001
17.077 bln
+1.156 bln
7.26%
jan 1, 2002
20.622 bln
+3.545 bln
20.76%
jan 1, 2003
22.863 bln
+2.242 bln
10.87%
jan 1, 2004
28.741 bln
+5.877 bln
25.71%
jan 1, 2005
40.554 bln
+11.813 bln
41.1%
jan 1, 2006
53.603 bln
+13.048 bln
32.18%
jan 1, 2007
75.723 bln
+22.12 bln
41.27%
jan 1, 2008
97.346 bln
+21.623 bln
28.56%
jan 1, 2009
124.088 bln
+26.741 bln
27.47%
jan 1, 2010
110.005 bln
-14.083 bln
-11.35%
jan 1, 2011
140.131 bln
+30.126 bln
27.39%
jan 1, 2012
175.568 bln
+35.436 bln
25.29%
jan 1, 2013
191.319 bln
+15.752 bln
8.97%
jan 1, 2014
216.241 bln
+24.922 bln
13.03%
jan 1, 2015
204.538 bln
-11.703 bln
-5.41%
jan 1, 2016
174.916 bln
-29.622 bln
-14.48%
Ranking of countries by current statistics by years


Comments: