29
/
en
AIzaSyAYiBZKx7MnpbEhh9jyipgxe19OcubqV5w
April 1, 2024
277756
Uruguay
URY
true
2
1
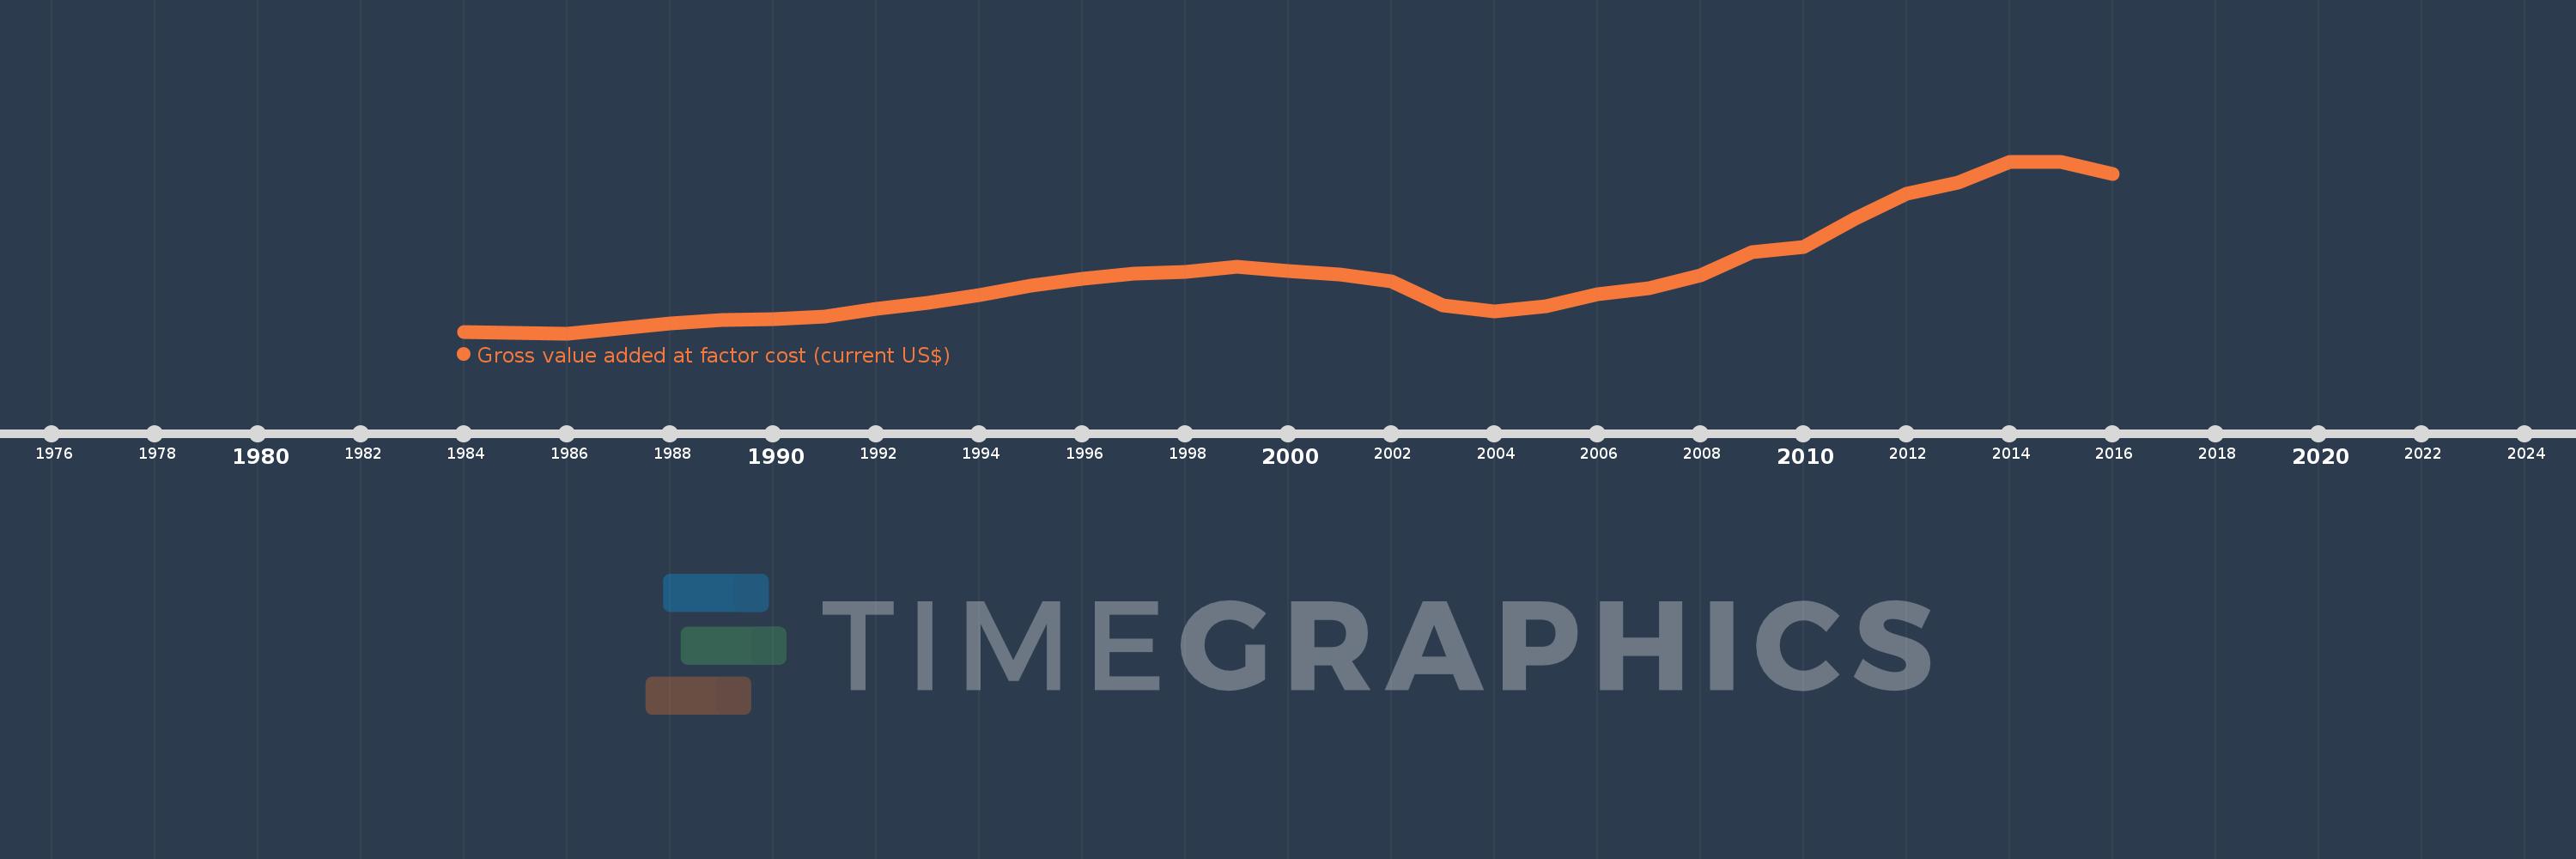
Gross value added at factor cost (current US$)
2016,2015,2014,2013,2012,2011,2010,2009,2008,2007,2006,2005,2004,2003,2002,2001,2000,1999,1998,1997,1996,1995,1994,1993,1992,1991,1990,1989,1988,1987,1986,1985,1984
This statistics in other country:
AfghanistanAlbaniaAlgeriaAndorraAntigua and BarbudaArgentinaArmeniaArubaAustraliaAustriaAzerbaijanBahamas, TheBahrainBangladeshBarbadosBelarusBelgiumBelizeBeninBermudaBhutanBoliviaBosnia and HerzegovinaBotswanaBrazilBulgariaBurkina FasoBurundiCabo VerdeCambodiaCameroonCanadaCaribbean small statesCayman IslandsCentral African RepublicCentral Europe and the BalticsChadChileColombiaCongo, Dem. Rep.Costa RicaCroatiaCubaCyprusCzech RepublicDenmarkDjiboutiDominicaDominican RepublicEarly-demographic dividendEcuadorEgypt, Arab Rep.El SalvadorEquatorial GuineaEritreaEstoniaEthiopiaEuro areaEurope & Central AsiaEurope & Central Asia (excluding high income)Europe & Central Asia (IDA & IBRD countries)European UnionFaroe IslandsFijiFinlandFranceGabonGambia, TheGeorgiaGermanyGhanaGreeceGrenadaGuatemalaGuineaGuinea-BissauGuyanaHeavily indebted poor countries (HIPC)High incomeHondurasHong Kong SAR, ChinaHungaryIcelandIDA blendIDA onlyIDA totalIndiaIndonesiaIran, Islamic Rep.IrelandItalyJamaicaJapanJordanKazakhstanKenyaKiribatiKorea, Rep.KosovoKuwaitKyrgyz RepublicLao PDRLatin America & Caribbean Latin America & Caribbean (excluding high income)Latin America & the Caribbean (IDA & IBRD countries)LatviaLeast developed countries: UN classificationLebanonLesothoLiberiaLibyaLiechtensteinLithuaniaLow incomeLower middle incomeLuxembourgMacao SAR, ChinaMacedonia, FYRMadagascarMalawiMalaysiaMaldivesMaliMaltaMarshall IslandsMauritaniaMauritiusMexicoMicronesia, Fed. Sts.Middle East & North Africa (excluding high income)Middle East & North Africa (IDA & IBRD countries)MoldovaMongoliaMontenegroMoroccoMozambiqueNamibiaNepalNetherlandsNew ZealandNicaraguaNigeriaNorth AmericaNorwayOECD membersOmanPacific island small statesPakistanPalauPanamaPapua New GuineaParaguayPeruPolandPortugalPost-demographic dividendPre-demographic dividendRomaniaRussian FederationRwandaSao Tome and PrincipeSenegalSerbiaSeychellesSierra LeoneSingaporeSlovak RepublicSloveniaSolomon IslandsSouth AfricaSouth AsiaSouth Asia (IDA & IBRD)SpainSri LankaSt. Kitts and NevisSt. LuciaSt. Vincent and the GrenadinesSub-Saharan Africa Sub-Saharan Africa (excluding high income)Sub-Saharan Africa (IDA & IBRD countries)SudanSurinameSwazilandSwedenSwitzerlandSyrian Arab RepublicTajikistanTanzaniaThailandTimor-LesteTongaTrinidad and TobagoTunisiaTurkeyTurkmenistanTuvaluUgandaUkraineUnited KingdomUnited StatesUruguayUzbekistanVanuatuVenezuela, RBVietnamWest Bank and GazaWorldYemen, Rep.ZambiaZimbabwe Timeline:
This timeline shows a graph from 1984 to 2016 of Uruguay. No data until 1983. Number of actual observations by date: 33.
Source name:
World Development Indicators
Source organization:
World Bank national accounts data, and OECD National Accounts data files.
Categories, topics:
Economy & Growth
Last updated:
apr 23, 2017
Indicators value changes by year
Minimum:
4.73 bln
jan 1, 1986
Maximum:
50.463 bln
jan 1, 2014
At the date of observation
Value
Absolute change
Change from previous value
jan 1, 1984
5.099 bln
+5.099 bln
0.0%
jan 1, 1985
4.85 bln
-249.032 mln
-4.88%
jan 1, 1986
4.73 bln
-119.7 mln
-2.47%
jan 1, 1987
5.881 bln
+1.151 bln
24.34%
jan 1, 1988
7.368 bln
+1.487 bln
25.28%
jan 1, 1989
8.214 bln
+845.486 mln
11.47%
jan 1, 1990
8.439 bln
+224.954 mln
2.74%
jan 1, 1991
9.299 bln
+860.028 mln
10.19%
jan 1, 1992
11.206 bln
+1.907 bln
20.51%
jan 1, 1993
12.878 bln
+1.672 bln
14.92%
jan 1, 1994
15.002 bln
+2.124 bln
16.49%
jan 1, 1995
17.475 bln
+2.473 bln
16.48%
jan 1, 1996
19.298 bln
+1.823 bln
10.43%
jan 1, 1997
20.516 bln
+1.218 bln
6.31%
jan 1, 1998
21.153 bln
+637.649 mln
3.11%
jan 1, 1999
22.426 bln
+1.273 bln
6.02%
jan 1, 2000
21.349 bln
-1.077 bln
-4.8%
jan 1, 2001
20.335 bln
-1.014 bln
-4.75%
jan 1, 2002
18.524 bln
-1.811 bln
-8.9%
jan 1, 2003
12.114 bln
-6.41 bln
-34.61%
jan 1, 2004
10.598 bln
-1.515 bln
-12.51%
jan 1, 2005
11.888 bln
+1.29 bln
12.17%
jan 1, 2006
15.057 bln
+3.169 bln
26.65%
jan 1, 2007
16.779 bln
+1.722 bln
11.44%
jan 1, 2008
20.137 bln
+3.358 bln
20.01%
jan 1, 2009
26.421 bln
+6.284 bln
31.21%
jan 1, 2010
27.799 bln
+1.378 bln
5.21%
jan 1, 2011
35.214 bln
+7.415 bln
26.67%
jan 1, 2012
41.858 bln
+6.644 bln
18.87%
jan 1, 2013
44.899 bln
+3.041 bln
7.26%
jan 1, 2014
50.463 bln
+5.564 bln
12.39%
jan 1, 2015
50.28 bln
-182.94 mln
-0.36%
jan 1, 2016
47.064 bln
-3.216 bln
-6.4%
Ranking of countries by current statistics by years


Comments: