29
/
en
AIzaSyAYiBZKx7MnpbEhh9jyipgxe19OcubqV5w
April 1, 2024
74930
Azerbaijan
AZE
true
2
1
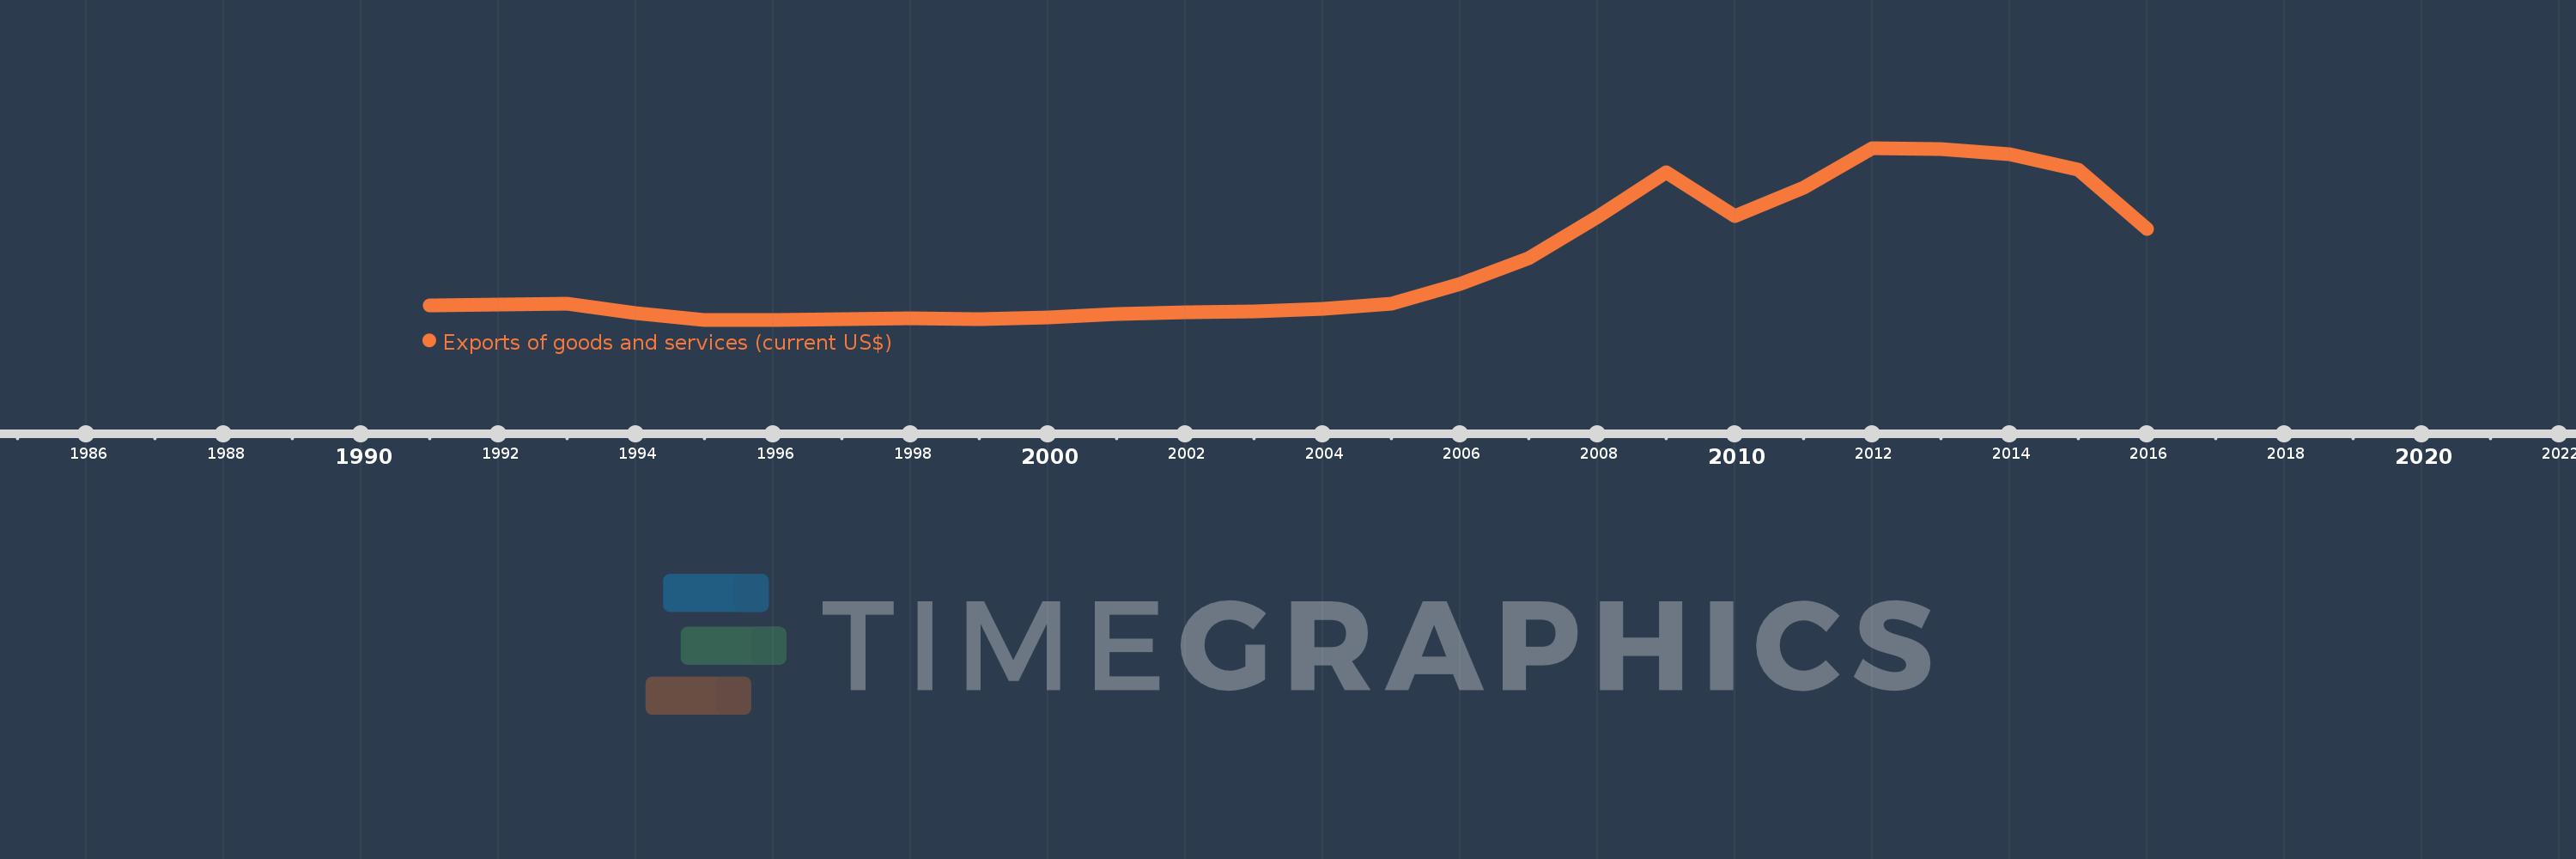
Exports of goods and services (current US$)
2016,2015,2014,2013,2012,2011,2010,2009,2008,2007,2006,2005,2004,2003,2002,2001,2000,1999,1998,1997,1996,1995,1994,1993,1992,1991
This statistics in other country:
AfghanistanAlbaniaAlgeriaAngolaAntigua and BarbudaArab WorldArgentinaArmeniaArubaAustraliaAustriaAzerbaijanBahamas, TheBahrainBangladeshBarbadosBelarusBelgiumBelizeBeninBermudaBhutanBoliviaBosnia and HerzegovinaBotswanaBrazilBrunei DarussalamBulgariaBurkina FasoBurundiCabo VerdeCambodiaCameroonCanadaCaribbean small statesCentral African RepublicCentral Europe and the BalticsChadChileChinaColombiaComorosCongo, Dem. Rep.Congo, Rep.Costa RicaCote d'IvoireCroatiaCubaCyprusCzech RepublicDenmarkDjiboutiDominicaDominican RepublicEarly-demographic dividendEast Asia & PacificEast Asia & Pacific (excluding high income)East Asia & Pacific (IDA & IBRD countries)EcuadorEgypt, Arab Rep.El SalvadorEquatorial GuineaEritreaEstoniaEthiopiaEuro areaEurope & Central AsiaEurope & Central Asia (excluding high income)Europe & Central Asia (IDA & IBRD countries)European UnionFaroe IslandsFijiFinlandFragile and conflict affected situationsFranceFrench PolynesiaGabonGambia, TheGeorgiaGermanyGhanaGreeceGrenadaGuatemalaGuineaGuinea-BissauGuyanaHaitiHeavily indebted poor countries (HIPC)High incomeHondurasHong Kong SAR, ChinaHungaryIBRD onlyIcelandIDA & IBRD totalIDA blendIDA onlyIDA totalIndiaIndonesiaIran, Islamic Rep.IraqIrelandIsraelItalyJamaicaJapanJordanKazakhstanKenyaKiribatiKorea, Rep.KosovoKuwaitKyrgyz RepublicLao PDRLate-demographic dividendLatin America & Caribbean Latin America & Caribbean (excluding high income)Latin America & the Caribbean (IDA & IBRD countries)LatviaLeast developed countries: UN classificationLebanonLesothoLiberiaLibyaLithuaniaLow & middle incomeLow incomeLower middle incomeLuxembourgMacao SAR, ChinaMacedonia, FYRMadagascarMalawiMalaysiaMaldivesMaliMaltaMauritaniaMauritiusMexicoMicronesia, Fed. Sts.Middle East & North AfricaMiddle East & North Africa (excluding high income)Middle East & North Africa (IDA & IBRD countries)Middle incomeMoldovaMongoliaMontenegroMoroccoMozambiqueMyanmarNamibiaNepalNetherlandsNew CaledoniaNew ZealandNicaraguaNigerNigeriaNorth AmericaNorwayOECD membersOmanOther small statesPacific island small statesPakistanPalauPanamaPapua New GuineaParaguayPeruPhilippinesPolandPortugalPost-demographic dividendPre-demographic dividendPuerto RicoQatarRomaniaRussian FederationRwandaSamoaSaudi ArabiaSenegalSerbiaSeychellesSierra LeoneSingaporeSlovak RepublicSloveniaSmall statesSolomon IslandsSomaliaSouth AfricaSouth AsiaSouth Asia (IDA & IBRD)South SudanSpainSri LankaSt. Kitts and NevisSt. LuciaSt. Vincent and the GrenadinesSub-Saharan Africa Sub-Saharan Africa (excluding high income)Sub-Saharan Africa (IDA & IBRD countries)SudanSurinameSwazilandSwedenSwitzerlandSyrian Arab RepublicTajikistanTanzaniaThailandTimor-LesteTogoTongaTrinidad and TobagoTunisiaTurkeyTurkmenistanUgandaUkraineUnited Arab EmiratesUnited KingdomUnited StatesUpper middle incomeUruguayUzbekistanVanuatuVenezuela, RBVietnamWest Bank and GazaWorldYemen, Rep.ZambiaZimbabwe Timeline:
This timeline shows a graph from 1991 to 2016 of Azerbaijan. No data until 1990. Number of actual observations by date: 26.
Source name:
World Development Indicators
Source organization:
World Bank national accounts data, and OECD National Accounts data files.
Categories, topics:
Economy & Growth, Trade
Last updated:
apr 23, 2017
Indicators value changes by year
Minimum:
819.243 mln
jan 1, 1995
Maximum:
37.215 bln
jan 1, 2012
At the date of observation
Value
Absolute change
Change from previous value
jan 1, 1991
3.885 bln
+3.885 bln
0.0%
jan 1, 1992
4.014 bln
+129.282 mln
3.33%
jan 1, 1993
4.303 bln
+288.246 mln
7.18%
jan 1, 1994
2.282 bln
-2.021 bln
-46.97%
jan 1, 1995
819.243 mln
-1.463 bln
-64.1%
jan 1, 1996
851.665 mln
+32.422 mln
3.96%
jan 1, 1997
937.64 mln
+85.975 mln
10.09%
jan 1, 1998
1.15 bln
+212.413 mln
22.65%
jan 1, 1999
1.009 bln
-140.618 mln
-12.23%
jan 1, 2000
1.282 bln
+272.555 mln
27.0%
jan 1, 2001
2.059 bln
+776.511 mln
60.57%
jan 1, 2002
2.336 bln
+277.23 mln
13.47%
jan 1, 2003
2.667 bln
+331.325 mln
14.19%
jan 1, 2004
3.057 bln
+389.557 mln
14.61%
jan 1, 2005
4.235 bln
+1.178 bln
38.55%
jan 1, 2006
8.336 bln
+4.101 bln
96.84%
jan 1, 2007
13.955 bln
+5.619 bln
67.4%
jan 1, 2008
22.518 bln
+8.562 bln
61.36%
jan 1, 2009
32.133 bln
+9.616 bln
42.7%
jan 1, 2010
22.87 bln
-9.263 bln
-28.83%
jan 1, 2011
28.729 bln
+5.858 bln
25.62%
jan 1, 2012
37.215 bln
+8.486 bln
29.54%
jan 1, 2013
36.915 bln
-299.67 mln
-0.81%
jan 1, 2014
35.842 bln
-1.073 bln
-2.91%
jan 1, 2015
32.551 bln
-3.29 bln
-9.18%
jan 1, 2016
20.059 bln
-12.492 bln
-38.38%
Ranking of countries by current statistics by years


Comments: