29
/
en
AIzaSyAYiBZKx7MnpbEhh9jyipgxe19OcubqV5w
April 1, 2024
262175
Thailand
THA
true
2
1
Exports of goods and services (current US$)
2016,2015,2014,2013,2012,2011,2010,2009,2008,2007,2006,2005,2004,2003,2002,2001,2000,1999,1998,1997,1996,1995,1994,1993,1992,1991,1990,1989,1988,1987,1986,1985,1984,1983,1982,1981,1980,1979,1978,1977,1976,1975,1974,1973,1972,1971,1970,1969,1968,1967,1966,1965,1964,1963,1962,1961
This statistics in other country:
AfghanistanAlbaniaAlgeriaAngolaAntigua and BarbudaArab WorldArgentinaArmeniaArubaAustraliaAustriaAzerbaijanBahamas, TheBahrainBangladeshBarbadosBelarusBelgiumBelizeBeninBermudaBhutanBoliviaBosnia and HerzegovinaBotswanaBrazilBrunei DarussalamBulgariaBurkina FasoBurundiCabo VerdeCambodiaCameroonCanadaCaribbean small statesCentral African RepublicCentral Europe and the BalticsChadChileChinaColombiaComorosCongo, Dem. Rep.Congo, Rep.Costa RicaCote d'IvoireCroatiaCubaCyprusCzech RepublicDenmarkDjiboutiDominicaDominican RepublicEarly-demographic dividendEast Asia & PacificEast Asia & Pacific (excluding high income)East Asia & Pacific (IDA & IBRD countries)EcuadorEgypt, Arab Rep.El SalvadorEquatorial GuineaEritreaEstoniaEthiopiaEuro areaEurope & Central AsiaEurope & Central Asia (excluding high income)Europe & Central Asia (IDA & IBRD countries)European UnionFaroe IslandsFijiFinlandFragile and conflict affected situationsFranceFrench PolynesiaGabonGambia, TheGeorgiaGermanyGhanaGreeceGrenadaGuatemalaGuineaGuinea-BissauGuyanaHaitiHeavily indebted poor countries (HIPC)High incomeHondurasHong Kong SAR, ChinaHungaryIBRD onlyIcelandIDA & IBRD totalIDA blendIDA onlyIDA totalIndiaIndonesiaIran, Islamic Rep.IraqIrelandIsraelItalyJamaicaJapanJordanKazakhstanKenyaKiribatiKorea, Rep.KosovoKuwaitKyrgyz RepublicLao PDRLate-demographic dividendLatin America & Caribbean Latin America & Caribbean (excluding high income)Latin America & the Caribbean (IDA & IBRD countries)LatviaLeast developed countries: UN classificationLebanonLesothoLiberiaLibyaLithuaniaLow & middle incomeLow incomeLower middle incomeLuxembourgMacao SAR, ChinaMacedonia, FYRMadagascarMalawiMalaysiaMaldivesMaliMaltaMauritaniaMauritiusMexicoMicronesia, Fed. Sts.Middle East & North AfricaMiddle East & North Africa (excluding high income)Middle East & North Africa (IDA & IBRD countries)Middle incomeMoldovaMongoliaMontenegroMoroccoMozambiqueMyanmarNamibiaNepalNetherlandsNew CaledoniaNew ZealandNicaraguaNigerNigeriaNorth AmericaNorwayOECD membersOmanOther small statesPacific island small statesPakistanPalauPanamaPapua New GuineaParaguayPeruPhilippinesPolandPortugalPost-demographic dividendPre-demographic dividendPuerto RicoQatarRomaniaRussian FederationRwandaSamoaSaudi ArabiaSenegalSerbiaSeychellesSierra LeoneSingaporeSlovak RepublicSloveniaSmall statesSolomon IslandsSomaliaSouth AfricaSouth AsiaSouth Asia (IDA & IBRD)South SudanSpainSri LankaSt. Kitts and NevisSt. LuciaSt. Vincent and the GrenadinesSub-Saharan Africa Sub-Saharan Africa (excluding high income)Sub-Saharan Africa (IDA & IBRD countries)SudanSurinameSwazilandSwedenSwitzerlandSyrian Arab RepublicTajikistanTanzaniaThailandTimor-LesteTogoTongaTrinidad and TobagoTunisiaTurkeyTurkmenistanUgandaUkraineUnited Arab EmiratesUnited KingdomUnited StatesUpper middle incomeUruguayUzbekistanVanuatuVenezuela, RBVietnamWest Bank and GazaWorldYemen, Rep.ZambiaZimbabwe Timeline:
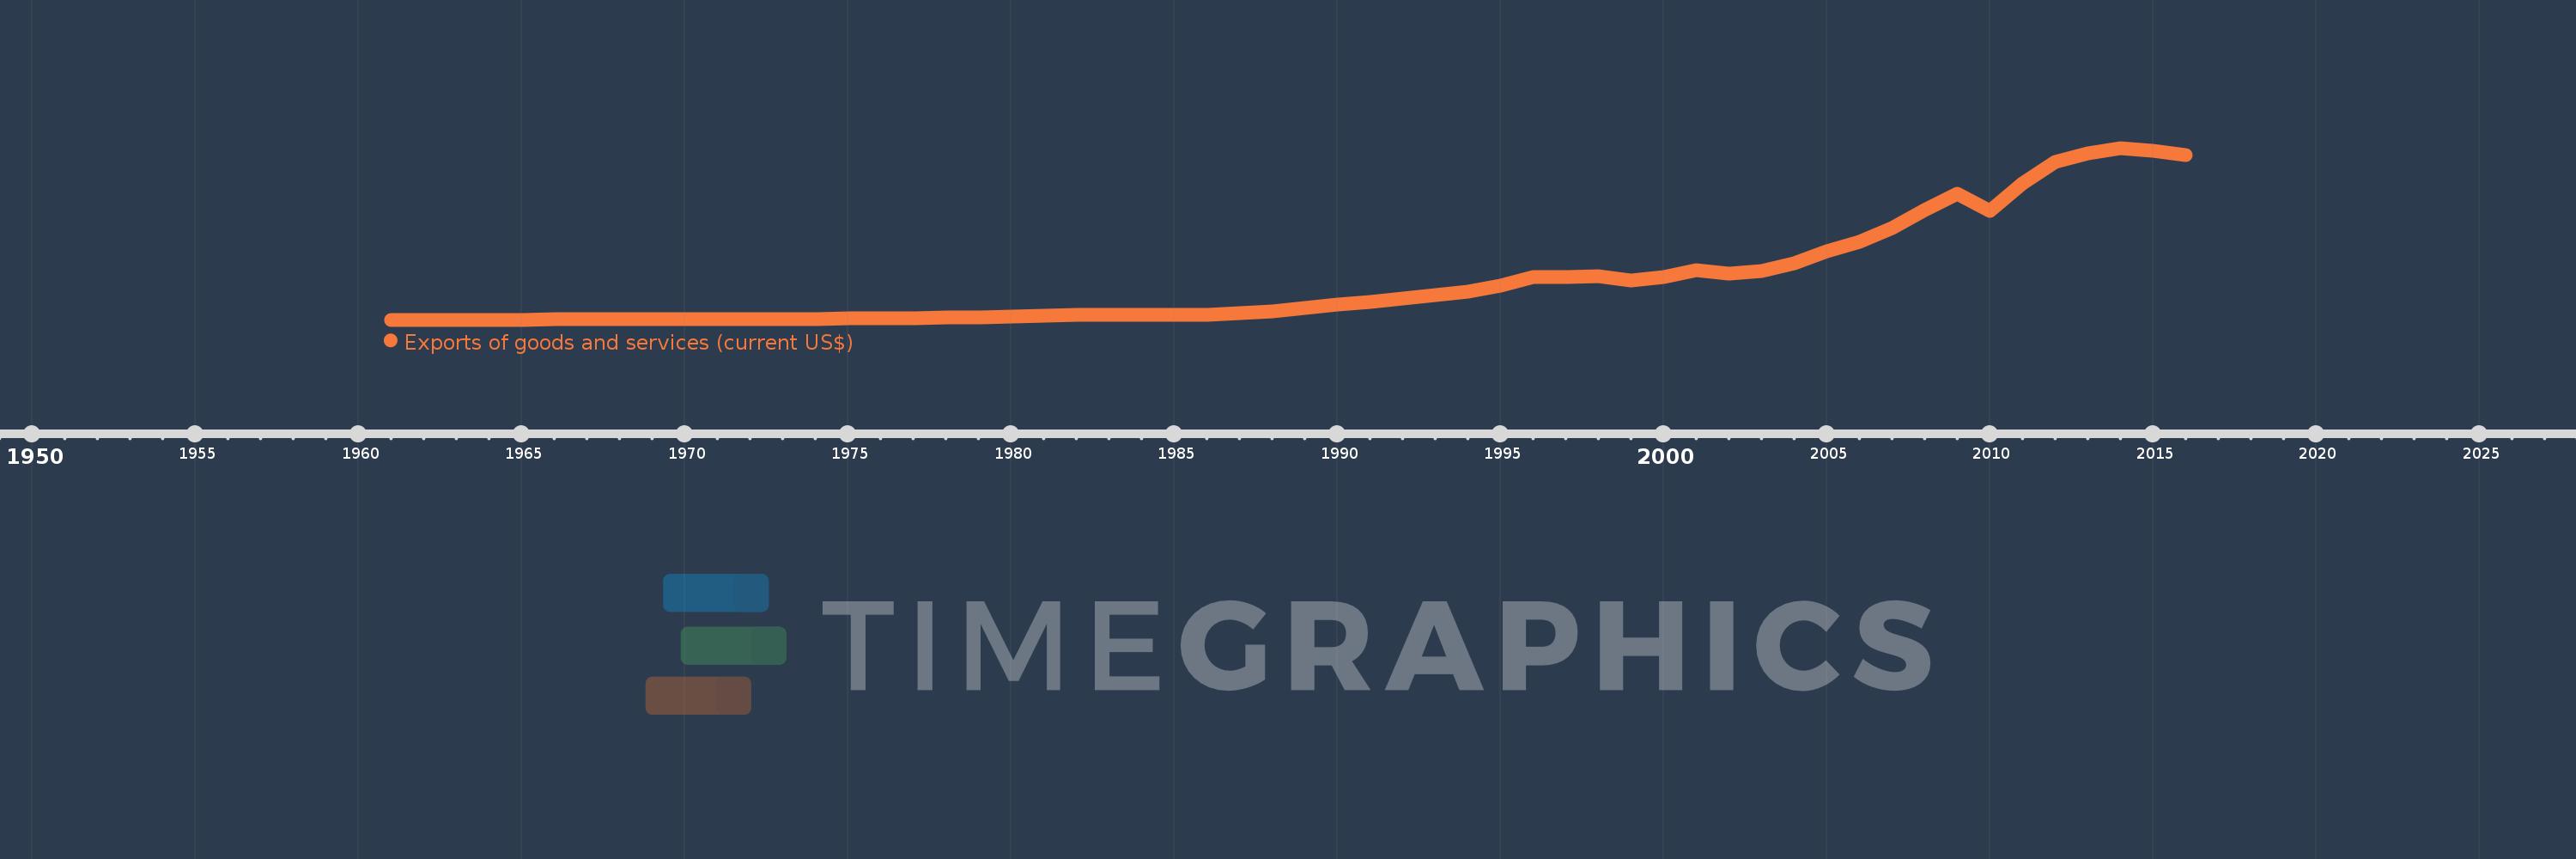
This timeline shows a graph from 1961 to 2016 of Thailand. No data until 1960. Number of actual observations by date: 56.
Source name:
World Development Indicators
Source organization:
World Bank national accounts data, and OECD National Accounts data files.
Categories, topics:
Economy & Growth, Trade
Last updated:
apr 23, 2017
Indicators value changes by year
Minimum:
445.713 mln
jan 1, 1961
Maximum:
284.138 bln
jan 1, 2014
At the date of observation
Value
Absolute change
Change from previous value
jan 1, 1961
445.713 mln
+445.713 mln
0.0%
jan 1, 1962
525.966 mln
+80.253 mln
18.01%
jan 1, 1963
519.061 mln
-6.905 mln
-1.31%
jan 1, 1964
535.814 mln
+16.752 mln
3.23%
jan 1, 1965
674.952 mln
+139.138 mln
25.97%
jan 1, 1966
739.76 mln
+64.808 mln
9.6%
jan 1, 1967
929.904 mln
+190.144 mln
25.7%
jan 1, 1968
1.024 bln
+94.135 mln
10.12%
jan 1, 1969
1.03 bln
+6.01 mln
0.59%
jan 1, 1970
1.075 bln
+45.337 mln
4.4%
jan 1, 1971
1.064 bln
-10.962 mln
-1.02%
jan 1, 1972
1.179 bln
+114.76 mln
10.78%
jan 1, 1973
1.488 bln
+308.317 mln
26.15%
jan 1, 1974
2.016 bln
+528.79 mln
35.55%
jan 1, 1975
2.958 bln
+942.076 mln
46.72%
jan 1, 1976
2.733 bln
-225.446 mln
-7.62%
jan 1, 1977
3.437 bln
+704.073 mln
25.76%
jan 1, 1978
3.948 bln
+510.635 mln
14.86%
jan 1, 1979
4.774 bln
+826.247 mln
20.93%
jan 1, 1980
6.178 bln
+1.404 bln
29.41%
jan 1, 1981
7.801 bln
+1.623 bln
26.27%
jan 1, 1982
8.31 bln
+509.001 mln
6.52%
jan 1, 1983
8.386 bln
+75.731 mln
0.91%
jan 1, 1984
8.053 bln
-332.52 mln
-3.97%
jan 1, 1985
9.154 bln
+1.101 bln
13.67%
jan 1, 1986
9.03 bln
-123.988 mln
-1.35%
jan 1, 1987
11.034 bln
+2.003 bln
22.18%
jan 1, 1988
14.602 bln
+3.568 bln
32.34%
jan 1, 1989
20.358 bln
+5.756 bln
39.42%
jan 1, 1990
25.231 bln
+4.874 bln
23.94%
jan 1, 1991
29.129 bln
+3.898 bln
15.45%
jan 1, 1992
35.329 bln
+6.2 bln
21.29%
jan 1, 1993
41.207 bln
+5.877 bln
16.64%
jan 1, 1994
47.454 bln
+6.247 bln
15.16%
jan 1, 1995
56.095 bln
+8.641 bln
18.21%
jan 1, 1996
70.305 bln
+14.211 bln
25.33%
jan 1, 1997
71.417 bln
+1.112 bln
1.58%
jan 1, 1998
72.443 bln
+1.025 bln
1.44%
jan 1, 1999
65.861 bln
-6.582 bln
-9.09%
jan 1, 2000
71.49 bln
+5.63 bln
8.55%
jan 1, 2001
81.953 bln
+10.463 bln
14.64%
jan 1, 2002
76.088 bln
-5.865 bln
-7.16%
jan 1, 2003
81.448 bln
+5.359 bln
7.04%
jan 1, 2004
93.687 bln
+12.239 bln
15.03%
jan 1, 2005
114.063 bln
+20.376 bln
21.75%
jan 1, 2006
129.499 bln
+15.436 bln
13.53%
jan 1, 2007
152.293 bln
+22.794 bln
17.6%
jan 1, 2008
181.094 bln
+28.801 bln
18.91%
jan 1, 2009
208.095 bln
+27.001 bln
14.91%
jan 1, 2010
180.543 bln
-27.552 bln
-13.24%
jan 1, 2011
225.514 bln
+44.971 bln
24.91%
jan 1, 2012
260.488 bln
+34.975 bln
15.51%
jan 1, 2013
275.335 bln
+14.847 bln
5.7%
jan 1, 2014
284.138 bln
+8.802 bln
3.2%
jan 1, 2015
280.135 bln
-4.003 bln
-1.41%
jan 1, 2016
272.899 bln
-7.235 bln
-2.58%
Ranking of countries by current statistics by years


Comments: