29
/
en
AIzaSyAYiBZKx7MnpbEhh9jyipgxe19OcubqV5w
April 1, 2024
265713
Tonga
TON
true
2
1
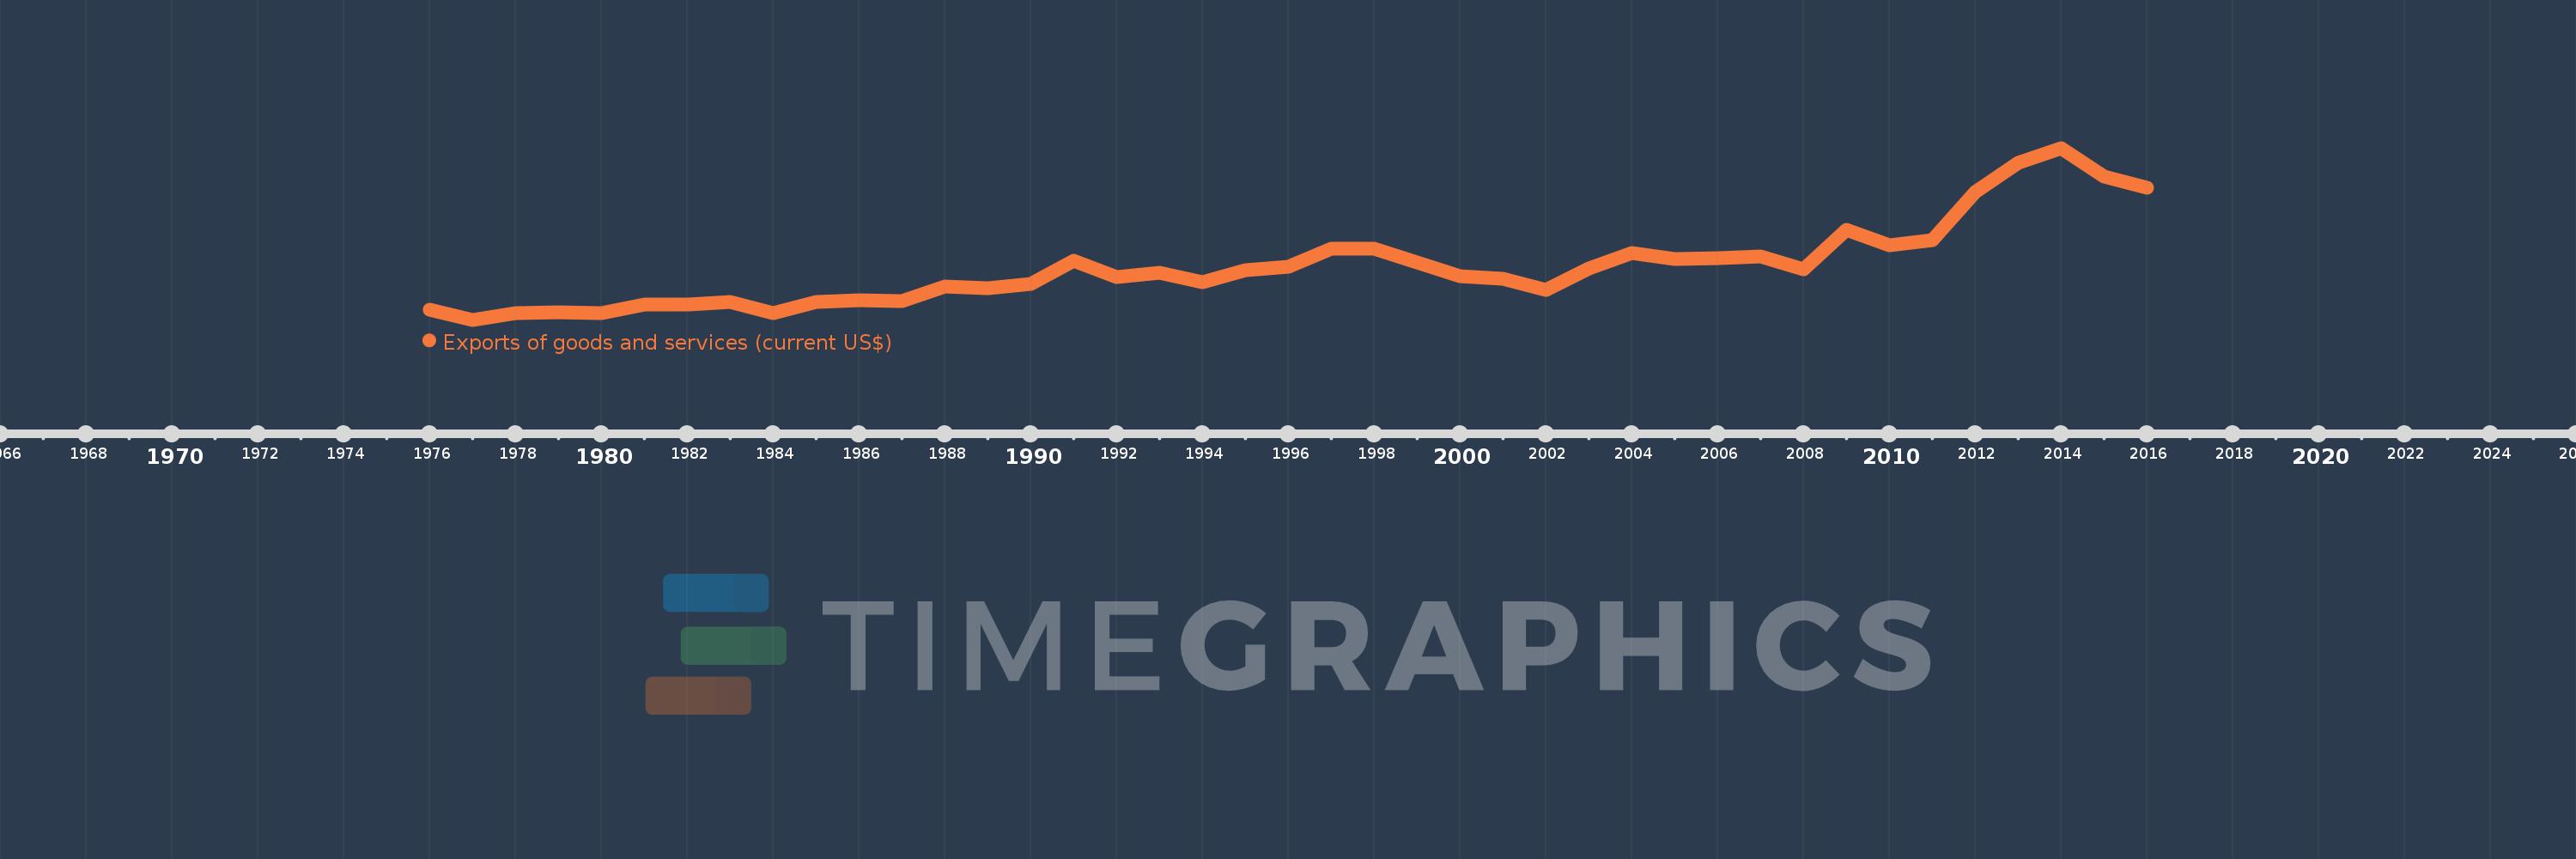
Exports of goods and services (current US$)
2016,2015,2014,2013,2012,2011,2010,2009,2008,2007,2006,2005,2004,2003,2002,2001,2000,1999,1998,1997,1996,1995,1994,1993,1992,1991,1990,1989,1988,1987,1986,1985,1984,1983,1982,1981,1980,1979,1978,1977,1976
This statistics in other country:
AfghanistanAlbaniaAlgeriaAngolaAntigua and BarbudaArab WorldArgentinaArmeniaArubaAustraliaAustriaAzerbaijanBahamas, TheBahrainBangladeshBarbadosBelarusBelgiumBelizeBeninBermudaBhutanBoliviaBosnia and HerzegovinaBotswanaBrazilBrunei DarussalamBulgariaBurkina FasoBurundiCabo VerdeCambodiaCameroonCanadaCaribbean small statesCentral African RepublicCentral Europe and the BalticsChadChileChinaColombiaComorosCongo, Dem. Rep.Congo, Rep.Costa RicaCote d'IvoireCroatiaCubaCyprusCzech RepublicDenmarkDjiboutiDominicaDominican RepublicEarly-demographic dividendEast Asia & PacificEast Asia & Pacific (excluding high income)East Asia & Pacific (IDA & IBRD countries)EcuadorEgypt, Arab Rep.El SalvadorEquatorial GuineaEritreaEstoniaEthiopiaEuro areaEurope & Central AsiaEurope & Central Asia (excluding high income)Europe & Central Asia (IDA & IBRD countries)European UnionFaroe IslandsFijiFinlandFragile and conflict affected situationsFranceFrench PolynesiaGabonGambia, TheGeorgiaGermanyGhanaGreeceGrenadaGuatemalaGuineaGuinea-BissauGuyanaHaitiHeavily indebted poor countries (HIPC)High incomeHondurasHong Kong SAR, ChinaHungaryIBRD onlyIcelandIDA & IBRD totalIDA blendIDA onlyIDA totalIndiaIndonesiaIran, Islamic Rep.IraqIrelandIsraelItalyJamaicaJapanJordanKazakhstanKenyaKiribatiKorea, Rep.KosovoKuwaitKyrgyz RepublicLao PDRLate-demographic dividendLatin America & Caribbean Latin America & Caribbean (excluding high income)Latin America & the Caribbean (IDA & IBRD countries)LatviaLeast developed countries: UN classificationLebanonLesothoLiberiaLibyaLithuaniaLow & middle incomeLow incomeLower middle incomeLuxembourgMacao SAR, ChinaMacedonia, FYRMadagascarMalawiMalaysiaMaldivesMaliMaltaMauritaniaMauritiusMexicoMicronesia, Fed. Sts.Middle East & North AfricaMiddle East & North Africa (excluding high income)Middle East & North Africa (IDA & IBRD countries)Middle incomeMoldovaMongoliaMontenegroMoroccoMozambiqueMyanmarNamibiaNepalNetherlandsNew CaledoniaNew ZealandNicaraguaNigerNigeriaNorth AmericaNorwayOECD membersOmanOther small statesPacific island small statesPakistanPalauPanamaPapua New GuineaParaguayPeruPhilippinesPolandPortugalPost-demographic dividendPre-demographic dividendPuerto RicoQatarRomaniaRussian FederationRwandaSamoaSaudi ArabiaSenegalSerbiaSeychellesSierra LeoneSingaporeSlovak RepublicSloveniaSmall statesSolomon IslandsSomaliaSouth AfricaSouth AsiaSouth Asia (IDA & IBRD)South SudanSpainSri LankaSt. Kitts and NevisSt. LuciaSt. Vincent and the GrenadinesSub-Saharan Africa Sub-Saharan Africa (excluding high income)Sub-Saharan Africa (IDA & IBRD countries)SudanSurinameSwazilandSwedenSwitzerlandSyrian Arab RepublicTajikistanTanzaniaThailandTimor-LesteTogoTongaTrinidad and TobagoTunisiaTurkeyTurkmenistanUgandaUkraineUnited Arab EmiratesUnited KingdomUnited StatesUpper middle incomeUruguayUzbekistanVanuatuVenezuela, RBVietnamWest Bank and GazaWorldYemen, Rep.ZambiaZimbabwe Timeline:
This timeline shows a graph from 1976 to 2016 of Tonga. No data until 1975. Number of actual observations by date: 41.
Source name:
World Development Indicators
Source organization:
World Bank national accounts data, and OECD National Accounts data files.
Categories, topics:
Economy & Growth, Trade
Last updated:
apr 23, 2017
Indicators value changes by year
Minimum:
8.091 mln
jan 1, 1977
Maximum:
96.757 mln
jan 1, 2014
At the date of observation
Value
Absolute change
Change from previous value
jan 1, 1976
13.435 mln
+13.435 mln
0.0%
jan 1, 1977
8.091 mln
-5.344 mln
-39.78%
jan 1, 1978
11.562 mln
+3.471 mln
42.9%
jan 1, 1979
11.967 mln
+405.382K
3.51%
jan 1, 1980
11.648 mln
-318.702K
-2.66%
jan 1, 1981
16.011 mln
+4.363 mln
37.45%
jan 1, 1982
15.794 mln
-217.089K
-1.36%
jan 1, 1983
17.123 mln
+1.329 mln
8.42%
jan 1, 1984
11.356 mln
-5.768 mln
-33.68%
jan 1, 1985
17.095 mln
+5.739 mln
50.54%
jan 1, 1986
18.095 mln
+999.622K
5.85%
jan 1, 1987
17.535 mln
-560.08K
-3.1%
jan 1, 1988
25.257 mln
+7.722 mln
44.04%
jan 1, 1989
24.25 mln
-1.007 mln
-3.99%
jan 1, 1990
26.696 mln
+2.446 mln
10.09%
jan 1, 1991
38.464 mln
+11.768 mln
44.08%
jan 1, 1992
30.278 mln
-8.186 mln
-21.28%
jan 1, 1993
32.405 mln
+2.127 mln
7.02%
jan 1, 1994
27.551 mln
-4.854 mln
-14.98%
jan 1, 1995
33.681 mln
+6.13 mln
22.25%
jan 1, 1996
35.423 mln
+1.742 mln
5.17%
jan 1, 1997
44.685 mln
+9.263 mln
26.15%
jan 1, 1998
44.848 mln
+162.2K
0.36%
jan 1, 1999
37.512 mln
-7.336 mln
-16.36%
jan 1, 2000
30.749 mln
-6.763 mln
-18.03%
jan 1, 2001
29.229 mln
-1.52 mln
-4.94%
jan 1, 2002
23.631 mln
-5.598 mln
-19.15%
jan 1, 2003
34.38 mln
+10.748 mln
45.48%
jan 1, 2004
42.522 mln
+8.142 mln
23.68%
jan 1, 2005
39.557 mln
-2.965 mln
-6.97%
jan 1, 2006
39.727 mln
+170.189K
0.43%
jan 1, 2007
40.754 mln
+1.027 mln
2.59%
jan 1, 2008
34.161 mln
-6.593 mln
-16.18%
jan 1, 2009
54.429 mln
+20.269 mln
59.33%
jan 1, 2010
46.484 mln
-7.945 mln
-14.6%
jan 1, 2011
49.18 mln
+2.696 mln
5.8%
jan 1, 2012
74.181 mln
+25.001 mln
50.84%
jan 1, 2013
89.108 mln
+14.927 mln
20.12%
jan 1, 2014
96.757 mln
+7.648 mln
8.58%
jan 1, 2015
82.041 mln
-14.716 mln
-15.21%
jan 1, 2016
76.266 mln
-5.774 mln
-7.04%
Ranking of countries by current statistics by years


Comments: