29
/
en
AIzaSyAYiBZKx7MnpbEhh9jyipgxe19OcubqV5w
April 1, 2024
248643
Sri Lanka
LKA
true
2
1
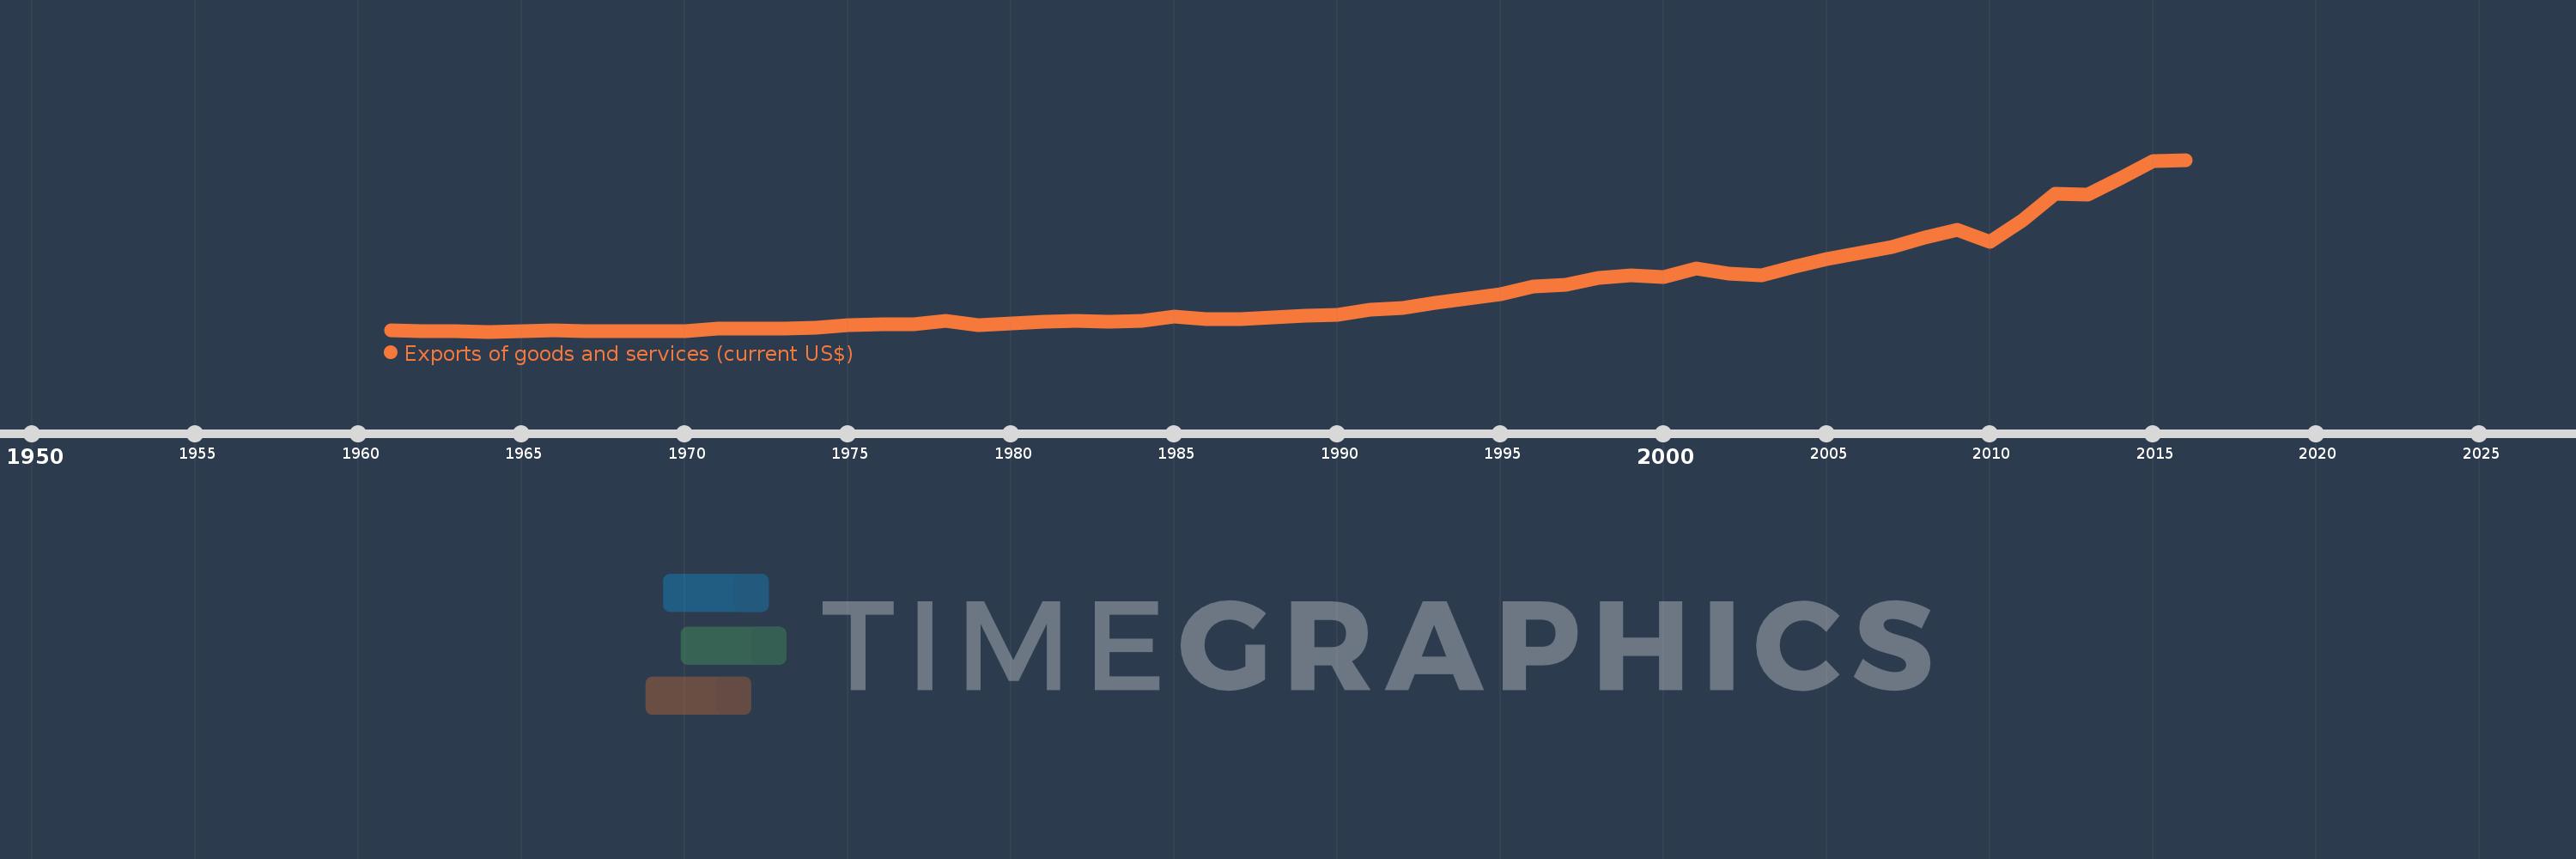
Exports of goods and services (current US$)
2016,2015,2014,2013,2012,2011,2010,2009,2008,2007,2006,2005,2004,2003,2002,2001,2000,1999,1998,1997,1996,1995,1994,1993,1992,1991,1990,1989,1988,1987,1986,1985,1984,1983,1982,1981,1980,1979,1978,1977,1976,1975,1974,1973,1972,1971,1970,1969,1968,1967,1966,1965,1964,1963,1962,1961
This statistics in other country:
AfghanistanAlbaniaAlgeriaAngolaAntigua and BarbudaArab WorldArgentinaArmeniaArubaAustraliaAustriaAzerbaijanBahamas, TheBahrainBangladeshBarbadosBelarusBelgiumBelizeBeninBermudaBhutanBoliviaBosnia and HerzegovinaBotswanaBrazilBrunei DarussalamBulgariaBurkina FasoBurundiCabo VerdeCambodiaCameroonCanadaCaribbean small statesCentral African RepublicCentral Europe and the BalticsChadChileChinaColombiaComorosCongo, Dem. Rep.Congo, Rep.Costa RicaCote d'IvoireCroatiaCubaCyprusCzech RepublicDenmarkDjiboutiDominicaDominican RepublicEarly-demographic dividendEast Asia & PacificEast Asia & Pacific (excluding high income)East Asia & Pacific (IDA & IBRD countries)EcuadorEgypt, Arab Rep.El SalvadorEquatorial GuineaEritreaEstoniaEthiopiaEuro areaEurope & Central AsiaEurope & Central Asia (excluding high income)Europe & Central Asia (IDA & IBRD countries)European UnionFaroe IslandsFijiFinlandFragile and conflict affected situationsFranceFrench PolynesiaGabonGambia, TheGeorgiaGermanyGhanaGreeceGrenadaGuatemalaGuineaGuinea-BissauGuyanaHaitiHeavily indebted poor countries (HIPC)High incomeHondurasHong Kong SAR, ChinaHungaryIBRD onlyIcelandIDA & IBRD totalIDA blendIDA onlyIDA totalIndiaIndonesiaIran, Islamic Rep.IraqIrelandIsraelItalyJamaicaJapanJordanKazakhstanKenyaKiribatiKorea, Rep.KosovoKuwaitKyrgyz RepublicLao PDRLate-demographic dividendLatin America & Caribbean Latin America & Caribbean (excluding high income)Latin America & the Caribbean (IDA & IBRD countries)LatviaLeast developed countries: UN classificationLebanonLesothoLiberiaLibyaLithuaniaLow & middle incomeLow incomeLower middle incomeLuxembourgMacao SAR, ChinaMacedonia, FYRMadagascarMalawiMalaysiaMaldivesMaliMaltaMauritaniaMauritiusMexicoMicronesia, Fed. Sts.Middle East & North AfricaMiddle East & North Africa (excluding high income)Middle East & North Africa (IDA & IBRD countries)Middle incomeMoldovaMongoliaMontenegroMoroccoMozambiqueMyanmarNamibiaNepalNetherlandsNew CaledoniaNew ZealandNicaraguaNigerNigeriaNorth AmericaNorwayOECD membersOmanOther small statesPacific island small statesPakistanPalauPanamaPapua New GuineaParaguayPeruPhilippinesPolandPortugalPost-demographic dividendPre-demographic dividendPuerto RicoQatarRomaniaRussian FederationRwandaSamoaSaudi ArabiaSenegalSerbiaSeychellesSierra LeoneSingaporeSlovak RepublicSloveniaSmall statesSolomon IslandsSomaliaSouth AfricaSouth AsiaSouth Asia (IDA & IBRD)South SudanSpainSri LankaSt. Kitts and NevisSt. LuciaSt. Vincent and the GrenadinesSub-Saharan Africa Sub-Saharan Africa (excluding high income)Sub-Saharan Africa (IDA & IBRD countries)SudanSurinameSwazilandSwedenSwitzerlandSyrian Arab RepublicTajikistanTanzaniaThailandTimor-LesteTogoTongaTrinidad and TobagoTunisiaTurkeyTurkmenistanUgandaUkraineUnited Arab EmiratesUnited KingdomUnited StatesUpper middle incomeUruguayUzbekistanVanuatuVenezuela, RBVietnamWest Bank and GazaWorldYemen, Rep.ZambiaZimbabwe Timeline:
This timeline shows a graph from 1961 to 2016 of Sri Lanka. No data until 1960. Number of actual observations by date: 56.
Source name:
World Development Indicators
Source organization:
World Bank national accounts data, and OECD National Accounts data files.
Categories, topics:
Economy & Growth, Trade
Last updated:
apr 23, 2017
Indicators value changes by year
Minimum:
319.558 mln
jan 1, 1964
Maximum:
16.896 bln
jan 1, 2016
At the date of observation
Value
Absolute change
Change from previous value
jan 1, 1961
422.303 mln
+422.303 mln
0.0%
jan 1, 1962
397.732 mln
-24.571 mln
-5.82%
jan 1, 1963
398.59 mln
+858.038K
0.22%
jan 1, 1964
319.558 mln
-79.033 mln
-19.83%
jan 1, 1965
322.401 mln
+2.844 mln
0.89%
jan 1, 1966
439.916 mln
+117.515 mln
36.45%
jan 1, 1967
391.807 mln
-48.109 mln
-10.94%
jan 1, 1968
380.453 mln
-11.354 mln
-2.9%
jan 1, 1969
371.463 mln
-8.989 mln
-2.36%
jan 1, 1970
361.513 mln
-9.951 mln
-2.68%
jan 1, 1971
584.538 mln
+223.025 mln
61.69%
jan 1, 1972
583.137 mln
-1.401 mln
-0.24%
jan 1, 1973
570.184 mln
-12.952 mln
-2.22%
jan 1, 1974
700.156 mln
+129.972 mln
22.79%
jan 1, 1975
944.812 mln
+244.656 mln
34.94%
jan 1, 1976
1.042 bln
+97.413 mln
10.31%
jan 1, 1977
1.043 bln
+937.509K
0.09%
jan 1, 1978
1.388 bln
+344.774 mln
33.05%
jan 1, 1979
950.352 mln
-437.585 mln
-31.53%
jan 1, 1980
1.134 bln
+183.88 mln
19.35%
jan 1, 1981
1.297 bln
+162.44 mln
14.32%
jan 1, 1982
1.345 bln
+48.366 mln
3.73%
jan 1, 1983
1.305 bln
-40.474 mln
-3.01%
jan 1, 1984
1.361 bln
+56.081 mln
4.3%
jan 1, 1985
1.741 bln
+380.117 mln
27.94%
jan 1, 1986
1.555 bln
-185.645 mln
-10.66%
jan 1, 1987
1.519 bln
-35.917 mln
-2.31%
jan 1, 1988
1.683 bln
+164.189 mln
10.81%
jan 1, 1989
1.82 bln
+136.321 mln
8.1%
jan 1, 1990
1.905 bln
+85.033 mln
4.67%
jan 1, 1991
2.424 bln
+519.545 mln
27.28%
jan 1, 1992
2.587 bln
+162.513 mln
6.7%
jan 1, 1993
3.083 bln
+495.881 mln
19.17%
jan 1, 1994
3.495 bln
+411.895 mln
13.36%
jan 1, 1995
3.962 bln
+467.482 mln
13.38%
jan 1, 1996
4.638 bln
+676.204 mln
17.07%
jan 1, 1997
4.861 bln
+222.24 mln
4.79%
jan 1, 1998
5.514 bln
+653.798 mln
13.45%
jan 1, 1999
5.725 bln
+210.4 mln
3.82%
jan 1, 2000
5.555 bln
-169.256 mln
-2.96%
jan 1, 2001
6.372 bln
+816.136 mln
14.69%
jan 1, 2002
5.878 bln
-493.327 mln
-7.74%
jan 1, 2003
5.773 bln
-104.799 mln
-1.78%
jan 1, 2004
6.543 bln
+769.738 mln
13.33%
jan 1, 2005
7.3 bln
+757.064 mln
11.57%
jan 1, 2006
7.892 bln
+591.962 mln
8.11%
jan 1, 2007
8.52 bln
+628.073 mln
7.96%
jan 1, 2008
9.419 bln
+898.483 mln
10.55%
jan 1, 2009
10.114 bln
+695.142 mln
7.38%
jan 1, 2010
8.972 bln
-1.142 bln
-11.29%
jan 1, 2011
11.091 bln
+2.119 bln
23.62%
jan 1, 2012
13.644 bln
+2.553 bln
23.02%
jan 1, 2013
13.561 bln
-82.829 mln
-0.61%
jan 1, 2014
15.102 bln
+1.54 bln
11.36%
jan 1, 2015
16.735 bln
+1.634 bln
10.82%
jan 1, 2016
16.896 bln
+160.591 mln
0.96%
Ranking of countries by current statistics by years


Comments: