29
/
en
AIzaSyAYiBZKx7MnpbEhh9jyipgxe19OcubqV5w
April 1, 2024
28073
East Asia & Pacific (excluding high income)
EAP
false
2
1
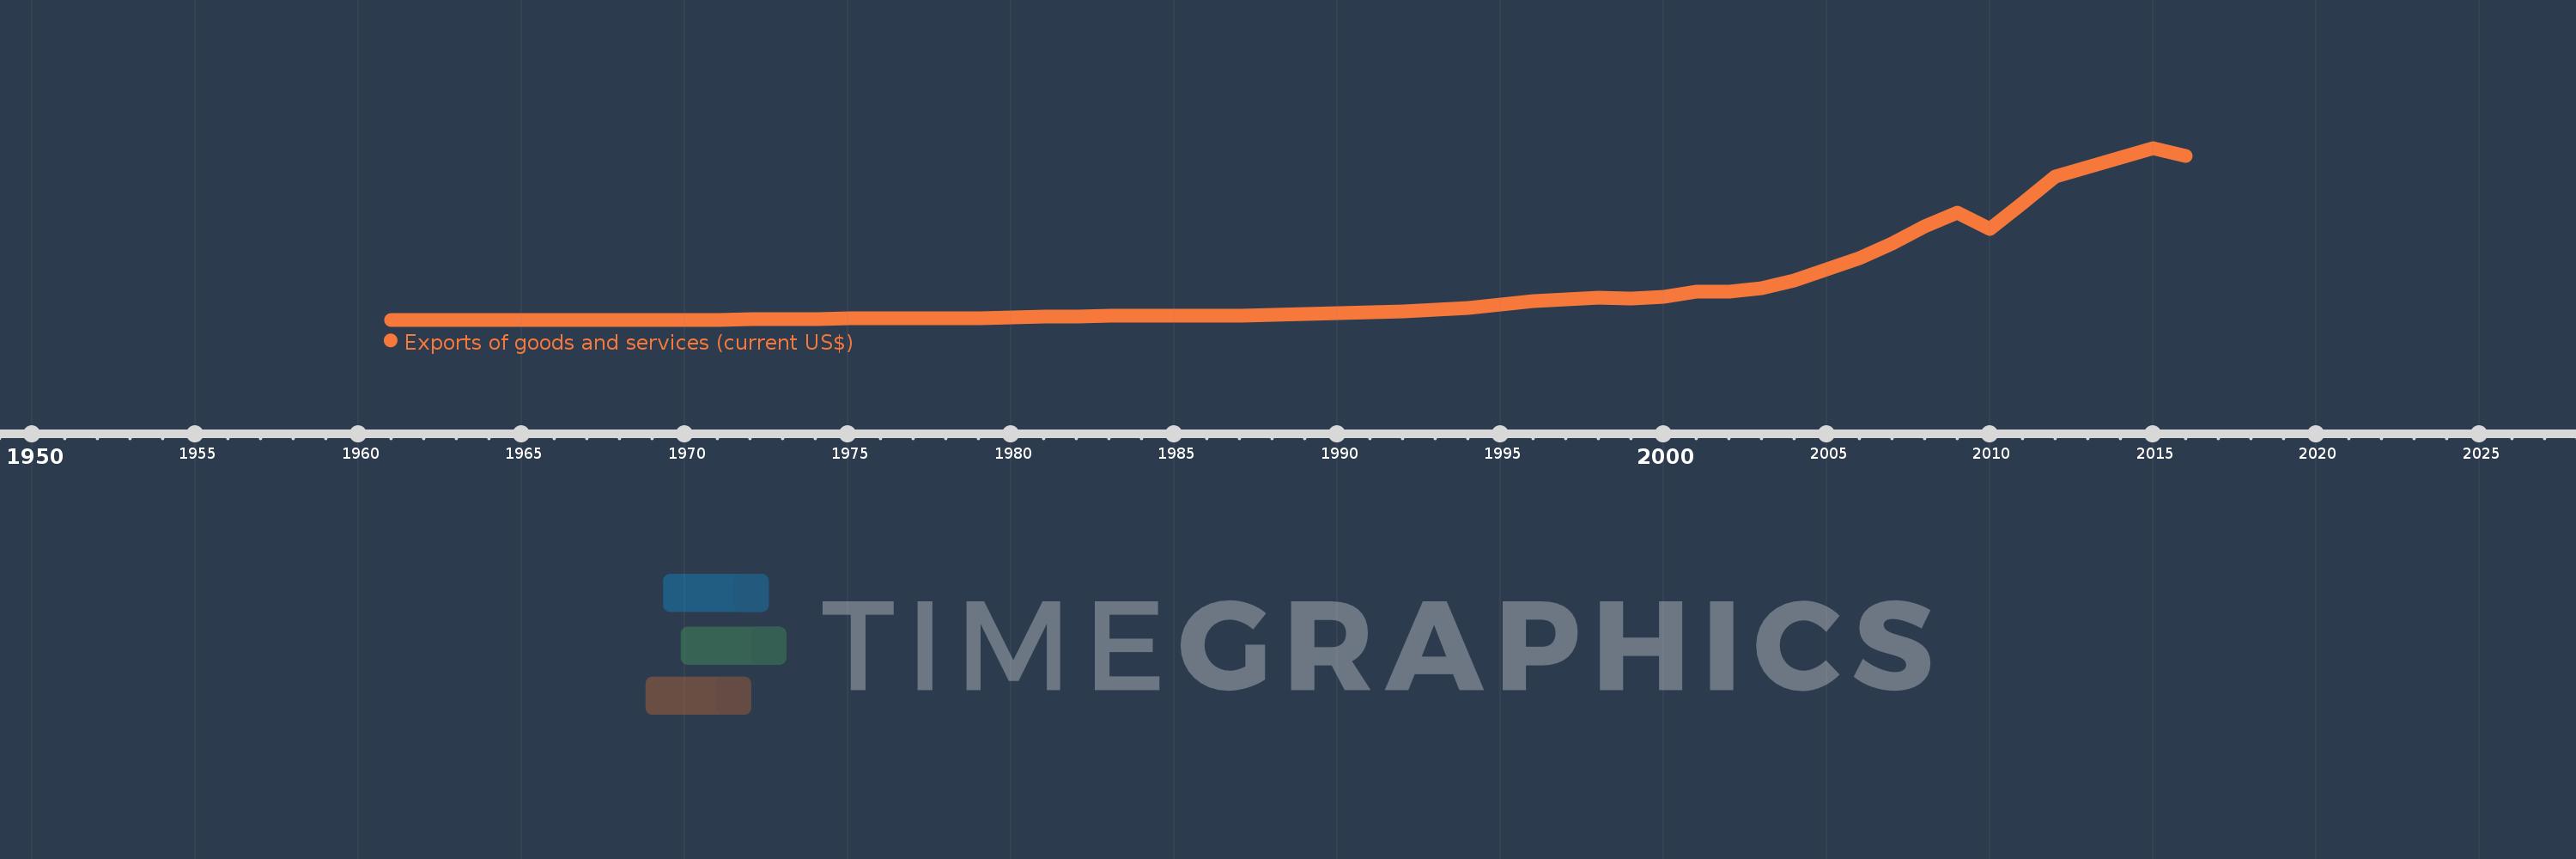
Exports of goods and services (current US$)
2016,2015,2014,2013,2012,2011,2010,2009,2008,2007,2006,2005,2004,2003,2002,2001,2000,1999,1998,1997,1996,1995,1994,1993,1992,1991,1990,1989,1988,1987,1986,1985,1984,1983,1982,1981,1980,1979,1978,1977,1976,1975,1974,1973,1972,1971,1970,1969,1968,1967,1966,1965,1964,1963,1962,1961
This statistics in other country:
AfghanistanAlbaniaAlgeriaAngolaAntigua and BarbudaArab WorldArgentinaArmeniaArubaAustraliaAustriaAzerbaijanBahamas, TheBahrainBangladeshBarbadosBelarusBelgiumBelizeBeninBermudaBhutanBoliviaBosnia and HerzegovinaBotswanaBrazilBrunei DarussalamBulgariaBurkina FasoBurundiCabo VerdeCambodiaCameroonCanadaCaribbean small statesCentral African RepublicCentral Europe and the BalticsChadChileChinaColombiaComorosCongo, Dem. Rep.Congo, Rep.Costa RicaCote d'IvoireCroatiaCubaCyprusCzech RepublicDenmarkDjiboutiDominicaDominican RepublicEarly-demographic dividendEast Asia & PacificEast Asia & Pacific (excluding high income)East Asia & Pacific (IDA & IBRD countries)EcuadorEgypt, Arab Rep.El SalvadorEquatorial GuineaEritreaEstoniaEthiopiaEuro areaEurope & Central AsiaEurope & Central Asia (excluding high income)Europe & Central Asia (IDA & IBRD countries)European UnionFaroe IslandsFijiFinlandFragile and conflict affected situationsFranceFrench PolynesiaGabonGambia, TheGeorgiaGermanyGhanaGreeceGrenadaGuatemalaGuineaGuinea-BissauGuyanaHaitiHeavily indebted poor countries (HIPC)High incomeHondurasHong Kong SAR, ChinaHungaryIBRD onlyIcelandIDA & IBRD totalIDA blendIDA onlyIDA totalIndiaIndonesiaIran, Islamic Rep.IraqIrelandIsraelItalyJamaicaJapanJordanKazakhstanKenyaKiribatiKorea, Rep.KosovoKuwaitKyrgyz RepublicLao PDRLate-demographic dividendLatin America & Caribbean Latin America & Caribbean (excluding high income)Latin America & the Caribbean (IDA & IBRD countries)LatviaLeast developed countries: UN classificationLebanonLesothoLiberiaLibyaLithuaniaLow & middle incomeLow incomeLower middle incomeLuxembourgMacao SAR, ChinaMacedonia, FYRMadagascarMalawiMalaysiaMaldivesMaliMaltaMauritaniaMauritiusMexicoMicronesia, Fed. Sts.Middle East & North AfricaMiddle East & North Africa (excluding high income)Middle East & North Africa (IDA & IBRD countries)Middle incomeMoldovaMongoliaMontenegroMoroccoMozambiqueMyanmarNamibiaNepalNetherlandsNew CaledoniaNew ZealandNicaraguaNigerNigeriaNorth AmericaNorwayOECD membersOmanOther small statesPacific island small statesPakistanPalauPanamaPapua New GuineaParaguayPeruPhilippinesPolandPortugalPost-demographic dividendPre-demographic dividendPuerto RicoQatarRomaniaRussian FederationRwandaSamoaSaudi ArabiaSenegalSerbiaSeychellesSierra LeoneSingaporeSlovak RepublicSloveniaSmall statesSolomon IslandsSomaliaSouth AfricaSouth AsiaSouth Asia (IDA & IBRD)South SudanSpainSri LankaSt. Kitts and NevisSt. LuciaSt. Vincent and the GrenadinesSub-Saharan Africa Sub-Saharan Africa (excluding high income)Sub-Saharan Africa (IDA & IBRD countries)SudanSurinameSwazilandSwedenSwitzerlandSyrian Arab RepublicTajikistanTanzaniaThailandTimor-LesteTogoTongaTrinidad and TobagoTunisiaTurkeyTurkmenistanUgandaUkraineUnited Arab EmiratesUnited KingdomUnited StatesUpper middle incomeUruguayUzbekistanVanuatuVenezuela, RBVietnamWest Bank and GazaWorldYemen, Rep.ZambiaZimbabwe Timeline:
This timeline shows a graph from 1961 to 2016 of East Asia & Pacific (excluding high income). No data until 1960. Number of actual observations by date: 56.
Source name:
World Development Indicators
Source organization:
World Bank national accounts data, and OECD National Accounts data files.
Categories, topics:
Economy & Growth, Trade
Last updated:
apr 23, 2017
Indicators value changes by year
Minimum:
5.021 bln
jan 1, 1963
Maximum:
3.56 trl
jan 1, 2015
At the date of observation
Value
Absolute change
Change from previous value
jan 1, 1961
5.858 bln
+5.858 bln
0.0%
jan 1, 1962
5.215 bln
-643.434 mln
-10.98%
jan 1, 1963
5.021 bln
-194.07 mln
-3.72%
jan 1, 1964
5.456 bln
+434.89 mln
8.66%
jan 1, 1965
5.963 bln
+507.078 mln
9.29%
jan 1, 1966
6.712 bln
+748.906 mln
12.56%
jan 1, 1967
7.264 bln
+552.214 mln
8.23%
jan 1, 1968
7.084 bln
-180.174 mln
-2.48%
jan 1, 1969
7.437 bln
+353.059 mln
4.98%
jan 1, 1970
7.811 bln
+374.092 mln
5.03%
jan 1, 1971
8.405 bln
+594.64 mln
7.61%
jan 1, 1972
9.287 bln
+881.205 mln
10.48%
jan 1, 1973
11.428 bln
+2.141 bln
23.06%
jan 1, 1974
18.63 bln
+7.202 bln
63.02%
jan 1, 1975
28.23 bln
+9.6 bln
51.53%
jan 1, 1976
27.341 bln
-889.167 mln
-3.15%
jan 1, 1977
31.064 bln
+3.723 bln
13.62%
jan 1, 1978
36.576 bln
+5.512 bln
17.74%
jan 1, 1979
39.312 bln
+2.736 bln
7.48%
jan 1, 1980
53.434 bln
+14.123 bln
35.92%
jan 1, 1981
71.691 bln
+18.257 bln
34.17%
jan 1, 1982
75.45 bln
+3.758 bln
5.24%
jan 1, 1983
80.503 bln
+5.053 bln
6.7%
jan 1, 1984
79.678 bln
-824.468 mln
-1.02%
jan 1, 1985
86.888 bln
+7.21 bln
9.05%
jan 1, 1986
83.99 bln
-2.898 bln
-3.34%
jan 1, 1987
81.364 bln
-2.626 bln
-3.13%
jan 1, 1988
102.526 bln
+21.162 bln
26.01%
jan 1, 1989
126.446 bln
+23.919 bln
23.33%
jan 1, 1990
137.823 bln
+11.377 bln
9.0%
jan 1, 1991
159.461 bln
+21.637 bln
15.7%
jan 1, 1992
186.263 bln
+26.802 bln
16.81%
jan 1, 1993
217.1 bln
+30.837 bln
16.56%
jan 1, 1994
248.537 bln
+31.437 bln
14.48%
jan 1, 1995
311.711 bln
+63.174 bln
25.42%
jan 1, 1996
383.119 bln
+71.408 bln
22.91%
jan 1, 1997
434.414 bln
+51.295 bln
13.39%
jan 1, 1998
463.002 bln
+28.588 bln
6.58%
jan 1, 1999
443.583 bln
-19.419 bln
-4.19%
jan 1, 2000
480.57 bln
+36.987 bln
8.34%
jan 1, 2001
585.158 bln
+104.588 bln
21.76%
jan 1, 2002
580.726 bln
-4.431 bln
-0.76%
jan 1, 2003
657.659 bln
+76.933 bln
13.25%
jan 1, 2004
815.512 bln
+157.852 bln
24.0%
jan 1, 2005
1.045 trl
+229.44 bln
28.13%
jan 1, 2006
1.276 trl
+230.749 bln
22.08%
jan 1, 2007
1.59 trl
+313.94 bln
24.61%
jan 1, 2008
1.929 trl
+339.797 bln
21.38%
jan 1, 2009
2.219 trl
+290.003 bln
15.03%
jan 1, 2010
1.88 trl
-339.141 bln
-15.28%
jan 1, 2011
2.41 trl
+529.944 bln
28.18%
jan 1, 2012
2.966 trl
+555.575 bln
23.05%
jan 1, 2013
3.167 trl
+201.551 bln
6.8%
jan 1, 2014
3.368 trl
+200.299 bln
6.32%
jan 1, 2015
3.56 trl
+191.954 bln
5.7%
jan 1, 2016
3.403 trl
-156.656 bln
-4.4%
Ranking of countries by current statistics by years


Comments: