29
/
en
AIzaSyAYiBZKx7MnpbEhh9jyipgxe19OcubqV5w
April 1, 2024
84021
Benin
BEN
true
2
1
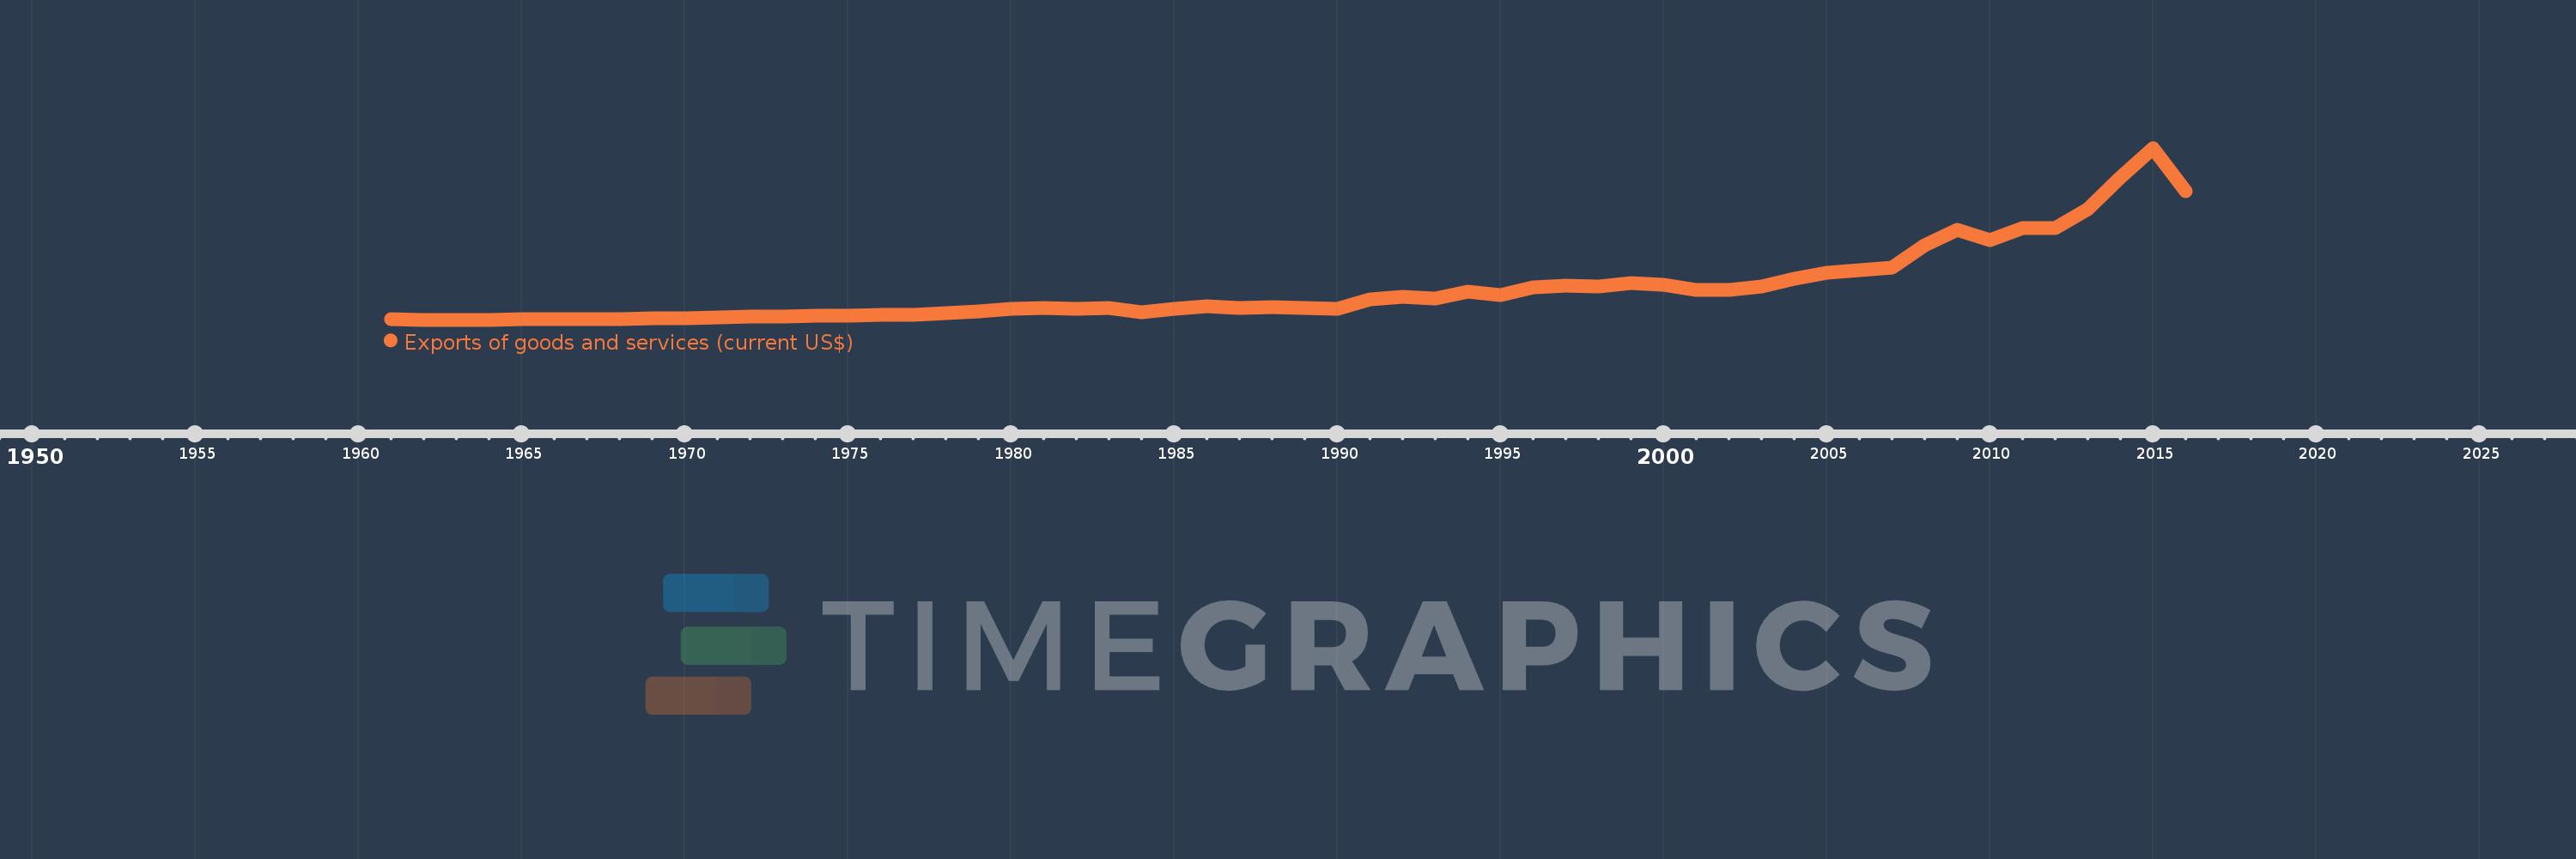
Exports of goods and services (current US$)
2016,2015,2014,2013,2012,2011,2010,2009,2008,2007,2006,2005,2004,2003,2002,2001,2000,1999,1998,1997,1996,1995,1994,1993,1992,1991,1990,1989,1988,1987,1986,1985,1984,1983,1982,1981,1980,1979,1978,1977,1976,1975,1974,1973,1972,1971,1970,1969,1968,1967,1966,1965,1964,1963,1962,1961
This statistics in other country:
AfghanistanAlbaniaAlgeriaAngolaAntigua and BarbudaArab WorldArgentinaArmeniaArubaAustraliaAustriaAzerbaijanBahamas, TheBahrainBangladeshBarbadosBelarusBelgiumBelizeBeninBermudaBhutanBoliviaBosnia and HerzegovinaBotswanaBrazilBrunei DarussalamBulgariaBurkina FasoBurundiCabo VerdeCambodiaCameroonCanadaCaribbean small statesCentral African RepublicCentral Europe and the BalticsChadChileChinaColombiaComorosCongo, Dem. Rep.Congo, Rep.Costa RicaCote d'IvoireCroatiaCubaCyprusCzech RepublicDenmarkDjiboutiDominicaDominican RepublicEarly-demographic dividendEast Asia & PacificEast Asia & Pacific (excluding high income)East Asia & Pacific (IDA & IBRD countries)EcuadorEgypt, Arab Rep.El SalvadorEquatorial GuineaEritreaEstoniaEthiopiaEuro areaEurope & Central AsiaEurope & Central Asia (excluding high income)Europe & Central Asia (IDA & IBRD countries)European UnionFaroe IslandsFijiFinlandFragile and conflict affected situationsFranceFrench PolynesiaGabonGambia, TheGeorgiaGermanyGhanaGreeceGrenadaGuatemalaGuineaGuinea-BissauGuyanaHaitiHeavily indebted poor countries (HIPC)High incomeHondurasHong Kong SAR, ChinaHungaryIBRD onlyIcelandIDA & IBRD totalIDA blendIDA onlyIDA totalIndiaIndonesiaIran, Islamic Rep.IraqIrelandIsraelItalyJamaicaJapanJordanKazakhstanKenyaKiribatiKorea, Rep.KosovoKuwaitKyrgyz RepublicLao PDRLate-demographic dividendLatin America & Caribbean Latin America & Caribbean (excluding high income)Latin America & the Caribbean (IDA & IBRD countries)LatviaLeast developed countries: UN classificationLebanonLesothoLiberiaLibyaLithuaniaLow & middle incomeLow incomeLower middle incomeLuxembourgMacao SAR, ChinaMacedonia, FYRMadagascarMalawiMalaysiaMaldivesMaliMaltaMauritaniaMauritiusMexicoMicronesia, Fed. Sts.Middle East & North AfricaMiddle East & North Africa (excluding high income)Middle East & North Africa (IDA & IBRD countries)Middle incomeMoldovaMongoliaMontenegroMoroccoMozambiqueMyanmarNamibiaNepalNetherlandsNew CaledoniaNew ZealandNicaraguaNigerNigeriaNorth AmericaNorwayOECD membersOmanOther small statesPacific island small statesPakistanPalauPanamaPapua New GuineaParaguayPeruPhilippinesPolandPortugalPost-demographic dividendPre-demographic dividendPuerto RicoQatarRomaniaRussian FederationRwandaSamoaSaudi ArabiaSenegalSerbiaSeychellesSierra LeoneSingaporeSlovak RepublicSloveniaSmall statesSolomon IslandsSomaliaSouth AfricaSouth AsiaSouth Asia (IDA & IBRD)South SudanSpainSri LankaSt. Kitts and NevisSt. LuciaSt. Vincent and the GrenadinesSub-Saharan Africa Sub-Saharan Africa (excluding high income)Sub-Saharan Africa (IDA & IBRD countries)SudanSurinameSwazilandSwedenSwitzerlandSyrian Arab RepublicTajikistanTanzaniaThailandTimor-LesteTogoTongaTrinidad and TobagoTunisiaTurkeyTurkmenistanUgandaUkraineUnited Arab EmiratesUnited KingdomUnited StatesUpper middle incomeUruguayUzbekistanVanuatuVenezuela, RBVietnamWest Bank and GazaWorldYemen, Rep.ZambiaZimbabwe Timeline:
This timeline shows a graph from 1961 to 2016 of Benin. No data until 1960. Number of actual observations by date: 56.
Source name:
World Development Indicators
Source organization:
World Bank national accounts data, and OECD National Accounts data files.
Categories, topics:
Economy & Growth, Trade
Last updated:
apr 23, 2017
Indicators value changes by year
Minimum:
8.317 mln
jan 1, 1963
Maximum:
3.114 bln
jan 1, 2015
At the date of observation
Value
Absolute change
Change from previous value
jan 1, 1961
13.852 mln
+13.852 mln
0.0%
jan 1, 1962
10.802 mln
-3.05 mln
-22.02%
jan 1, 1963
8.317 mln
-2.484 mln
-23.0%
jan 1, 1964
9.703 mln
+1.386 mln
16.67%
jan 1, 1965
13.862 mln
+4.158 mln
42.85%
jan 1, 1966
21.069 mln
+7.208 mln
52.0%
jan 1, 1967
20.74 mln
-329.384K
-1.56%
jan 1, 1968
23.474 mln
+2.735 mln
13.18%
jan 1, 1969
30.461 mln
+6.987 mln
29.76%
jan 1, 1970
38.94 mln
+8.479 mln
27.83%
jan 1, 1971
50.633 mln
+11.694 mln
30.03%
jan 1, 1972
59.595 mln
+8.962 mln
17.7%
jan 1, 1973
59.024 mln
-571.613K
-0.96%
jan 1, 1974
78.995 mln
+19.971 mln
33.84%
jan 1, 1975
79.409 mln
+413.321K
0.52%
jan 1, 1976
98.337 mln
+18.929 mln
23.84%
jan 1, 1977
90.732 mln
-7.605 mln
-7.73%
jan 1, 1978
121.35 mln
+30.618 mln
33.75%
jan 1, 1979
153.492 mln
+32.142 mln
26.49%
jan 1, 1980
207.785 mln
+54.293 mln
35.37%
jan 1, 1981
222.262 mln
+14.477 mln
6.97%
jan 1, 1982
205.682 mln
-16.58 mln
-7.46%
jan 1, 1983
225.297 mln
+19.615 mln
9.54%
jan 1, 1984
150.767 mln
-74.53 mln
-33.08%
jan 1, 1985
205.805 mln
+55.039 mln
36.51%
jan 1, 1986
247.338 mln
+41.533 mln
20.18%
jan 1, 1987
222.807 mln
-24.531 mln
-9.92%
jan 1, 1988
238.542 mln
+15.734 mln
7.06%
jan 1, 1989
223.655 mln
-14.887 mln
-6.24%
jan 1, 1990
202.741 mln
-20.913 mln
-9.35%
jan 1, 1991
375.947 mln
+173.206 mln
85.43%
jan 1, 1992
417.201 mln
+41.254 mln
10.97%
jan 1, 1993
393.977 mln
-23.225 mln
-5.57%
jan 1, 1994
510.965 mln
+116.989 mln
29.69%
jan 1, 1995
452.687 mln
-58.278 mln
-11.41%
jan 1, 1996
593.804 mln
+141.117 mln
31.17%
jan 1, 1997
625.668 mln
+31.864 mln
5.37%
jan 1, 1998
616.437 mln
-9.231 mln
-1.48%
jan 1, 1999
665.157 mln
+48.72 mln
7.9%
jan 1, 2000
637.162 mln
-27.995 mln
-4.21%
jan 1, 2001
543.136 mln
-94.026 mln
-14.76%
jan 1, 2002
545.401 mln
+2.265 mln
0.42%
jan 1, 2003
616.653 mln
+71.252 mln
13.06%
jan 1, 2004
741.397 mln
+124.744 mln
20.23%
jan 1, 2005
850.867 mln
+109.47 mln
14.77%
jan 1, 2006
909.439 mln
+58.572 mln
6.88%
jan 1, 2007
952.781 mln
+43.343 mln
4.77%
jan 1, 2008
1.348 bln
+395.528 mln
41.51%
jan 1, 2009
1.63 bln
+281.863 mln
20.9%
jan 1, 2010
1.446 bln
-184.345 mln
-11.31%
jan 1, 2011
1.658 bln
+212.234 mln
14.68%
jan 1, 2012
1.671 bln
+12.751 mln
0.77%
jan 1, 2013
2.005 bln
+334.174 mln
20.0%
jan 1, 2014
2.578 bln
+572.942 mln
28.58%
jan 1, 2015
3.114 bln
+535.852 mln
20.79%
jan 1, 2016
2.34 bln
-773.936 mln
-24.86%
Ranking of countries by current statistics by years


Comments: