29
/
en
AIzaSyAYiBZKx7MnpbEhh9jyipgxe19OcubqV5w
April 1, 2024
229684
Russian Federation
RUS
true
2
1
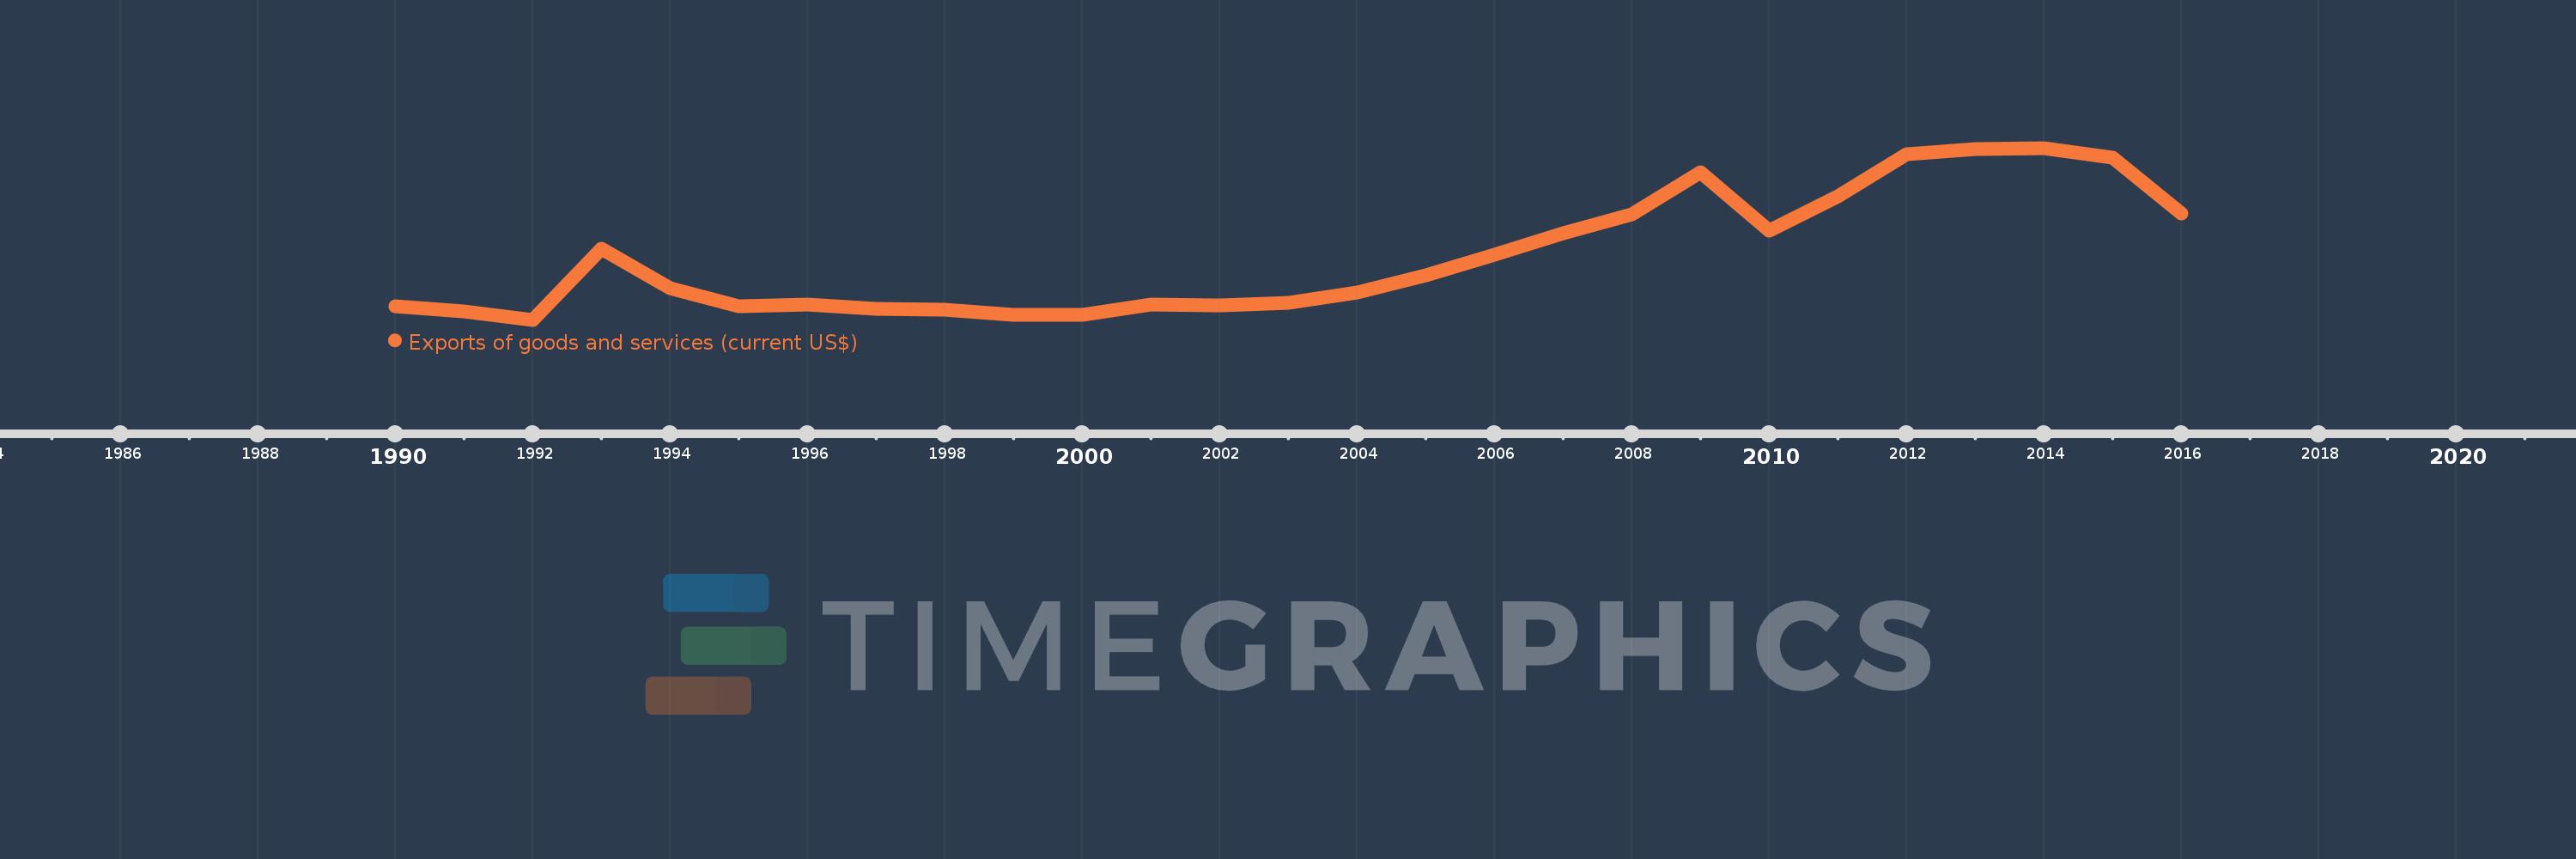
Exports of goods and services (current US$)
2016,2015,2014,2013,2012,2011,2010,2009,2008,2007,2006,2005,2004,2003,2002,2001,2000,1999,1998,1997,1996,1995,1994,1993,1992,1991,1990
This statistics in other country:
AfghanistanAlbaniaAlgeriaAngolaAntigua and BarbudaArab WorldArgentinaArmeniaArubaAustraliaAustriaAzerbaijanBahamas, TheBahrainBangladeshBarbadosBelarusBelgiumBelizeBeninBermudaBhutanBoliviaBosnia and HerzegovinaBotswanaBrazilBrunei DarussalamBulgariaBurkina FasoBurundiCabo VerdeCambodiaCameroonCanadaCaribbean small statesCentral African RepublicCentral Europe and the BalticsChadChileChinaColombiaComorosCongo, Dem. Rep.Congo, Rep.Costa RicaCote d'IvoireCroatiaCubaCyprusCzech RepublicDenmarkDjiboutiDominicaDominican RepublicEarly-demographic dividendEast Asia & PacificEast Asia & Pacific (excluding high income)East Asia & Pacific (IDA & IBRD countries)EcuadorEgypt, Arab Rep.El SalvadorEquatorial GuineaEritreaEstoniaEthiopiaEuro areaEurope & Central AsiaEurope & Central Asia (excluding high income)Europe & Central Asia (IDA & IBRD countries)European UnionFaroe IslandsFijiFinlandFragile and conflict affected situationsFranceFrench PolynesiaGabonGambia, TheGeorgiaGermanyGhanaGreeceGrenadaGuatemalaGuineaGuinea-BissauGuyanaHaitiHeavily indebted poor countries (HIPC)High incomeHondurasHong Kong SAR, ChinaHungaryIBRD onlyIcelandIDA & IBRD totalIDA blendIDA onlyIDA totalIndiaIndonesiaIran, Islamic Rep.IraqIrelandIsraelItalyJamaicaJapanJordanKazakhstanKenyaKiribatiKorea, Rep.KosovoKuwaitKyrgyz RepublicLao PDRLate-demographic dividendLatin America & Caribbean Latin America & Caribbean (excluding high income)Latin America & the Caribbean (IDA & IBRD countries)LatviaLeast developed countries: UN classificationLebanonLesothoLiberiaLibyaLithuaniaLow & middle incomeLow incomeLower middle incomeLuxembourgMacao SAR, ChinaMacedonia, FYRMadagascarMalawiMalaysiaMaldivesMaliMaltaMauritaniaMauritiusMexicoMicronesia, Fed. Sts.Middle East & North AfricaMiddle East & North Africa (excluding high income)Middle East & North Africa (IDA & IBRD countries)Middle incomeMoldovaMongoliaMontenegroMoroccoMozambiqueMyanmarNamibiaNepalNetherlandsNew CaledoniaNew ZealandNicaraguaNigerNigeriaNorth AmericaNorwayOECD membersOmanOther small statesPacific island small statesPakistanPalauPanamaPapua New GuineaParaguayPeruPhilippinesPolandPortugalPost-demographic dividendPre-demographic dividendPuerto RicoQatarRomaniaRussian FederationRwandaSamoaSaudi ArabiaSenegalSerbiaSeychellesSierra LeoneSingaporeSlovak RepublicSloveniaSmall statesSolomon IslandsSomaliaSouth AfricaSouth AsiaSouth Asia (IDA & IBRD)South SudanSpainSri LankaSt. Kitts and NevisSt. LuciaSt. Vincent and the GrenadinesSub-Saharan Africa Sub-Saharan Africa (excluding high income)Sub-Saharan Africa (IDA & IBRD countries)SudanSurinameSwazilandSwedenSwitzerlandSyrian Arab RepublicTajikistanTanzaniaThailandTimor-LesteTogoTongaTrinidad and TobagoTunisiaTurkeyTurkmenistanUgandaUkraineUnited Arab EmiratesUnited KingdomUnited StatesUpper middle incomeUruguayUzbekistanVanuatuVenezuela, RBVietnamWest Bank and GazaWorldYemen, Rep.ZambiaZimbabwe Timeline:
This timeline shows a graph from 1990 to 2016 of Russian Federation. No data until 1989. Number of actual observations by date: 27.
Source name:
World Development Indicators
Source organization:
World Bank national accounts data, and OECD National Accounts data files.
Categories, topics:
Economy & Growth, Trade
Last updated:
apr 23, 2017
Indicators value changes by year
Minimum:
68.741 bln
jan 1, 1992
Maximum:
594.258 bln
jan 1, 2014
At the date of observation
Value
Absolute change
Change from previous value
jan 1, 1990
110.935 bln
+110.935 bln
0.0%
jan 1, 1991
93.864 bln
-17.071 bln
-15.39%
jan 1, 1992
68.741 bln
-25.123 bln
-26.77%
jan 1, 1993
286.864 bln
+218.124 bln
317.31%
jan 1, 1994
166.222 bln
-120.642 bln
-42.06%
jan 1, 1995
109.667 bln
-56.555 bln
-34.02%
jan 1, 1996
115.849 bln
+6.182 bln
5.64%
jan 1, 1997
102.134 bln
-13.715 bln
-11.84%
jan 1, 1998
100.138 bln
-1.996 bln
-1.95%
jan 1, 1999
84.596 bln
-15.543 bln
-15.52%
jan 1, 2000
84.671 bln
+75.43 mln
0.09%
jan 1, 2001
114.429 bln
+29.758 bln
35.15%
jan 1, 2002
113.116 bln
-1.313 bln
-1.15%
jan 1, 2003
121.649 bln
+8.533 bln
7.54%
jan 1, 2004
151.698 bln
+30.048 bln
24.7%
jan 1, 2005
203.415 bln
+51.718 bln
34.09%
jan 1, 2006
268.957 bln
+65.542 bln
32.22%
jan 1, 2007
333.908 bln
+64.951 bln
24.15%
jan 1, 2008
392.044 bln
+58.136 bln
17.41%
jan 1, 2009
520.004 bln
+127.96 bln
32.64%
jan 1, 2010
341.584 bln
-178.42 bln
-34.31%
jan 1, 2011
445.513 bln
+103.93 bln
30.43%
jan 1, 2012
574.624 bln
+129.11 bln
28.98%
jan 1, 2013
589.791 bln
+15.167 bln
2.64%
jan 1, 2014
594.258 bln
+4.468 bln
0.76%
jan 1, 2015
565.296 bln
-28.962 bln
-4.87%
jan 1, 2016
393.13 bln
-172.166 bln
-30.46%
Ranking of countries by current statistics by years


Comments: