29
/
en
AIzaSyAYiBZKx7MnpbEhh9jyipgxe19OcubqV5w
April 1, 2024
234591
Saudi Arabia
SAU
true
2
1
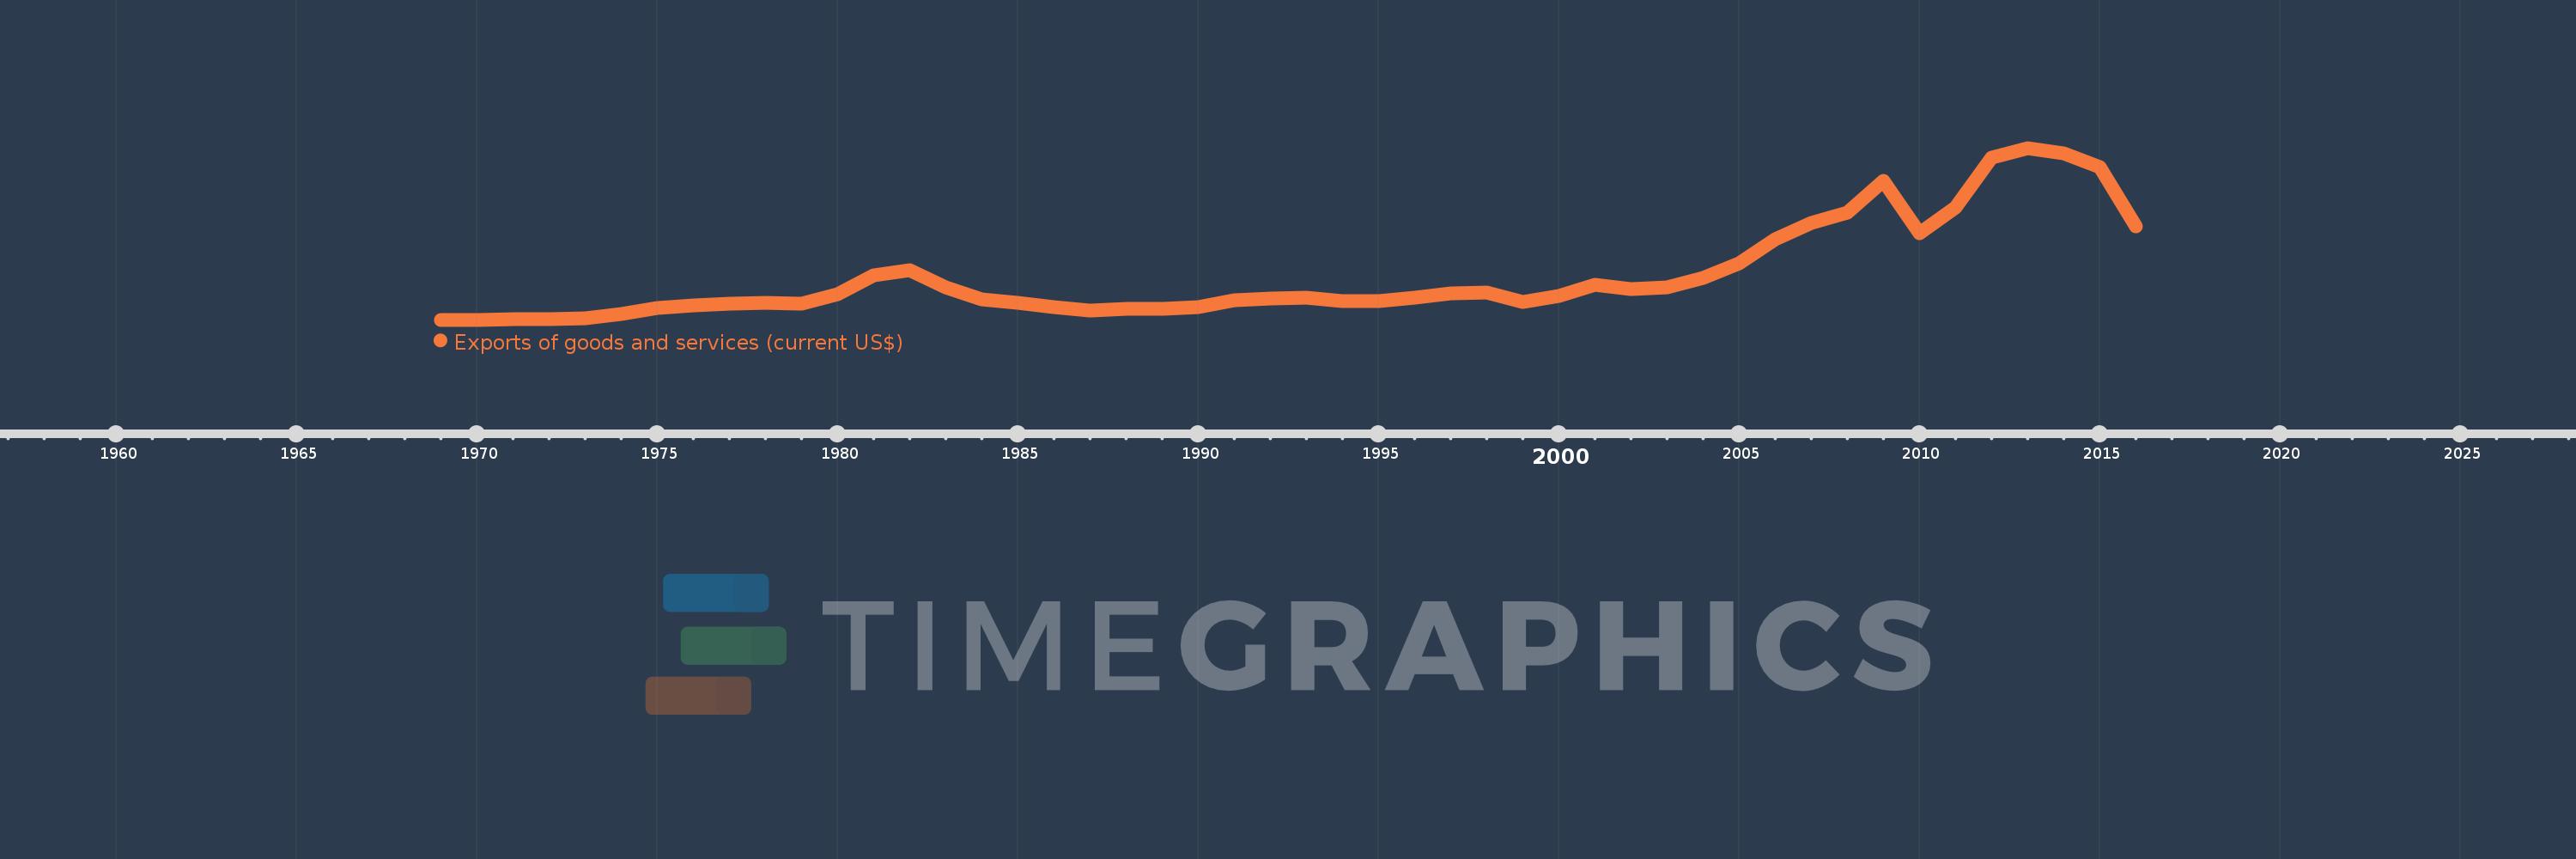
Exports of goods and services (current US$)
2016,2015,2014,2013,2012,2011,2010,2009,2008,2007,2006,2005,2004,2003,2002,2001,2000,1999,1998,1997,1996,1995,1994,1993,1992,1991,1990,1989,1988,1987,1986,1985,1984,1983,1982,1981,1980,1979,1978,1977,1976,1975,1974,1973,1972,1971,1970,1969
This statistics in other country:
AfghanistanAlbaniaAlgeriaAngolaAntigua and BarbudaArab WorldArgentinaArmeniaArubaAustraliaAustriaAzerbaijanBahamas, TheBahrainBangladeshBarbadosBelarusBelgiumBelizeBeninBermudaBhutanBoliviaBosnia and HerzegovinaBotswanaBrazilBrunei DarussalamBulgariaBurkina FasoBurundiCabo VerdeCambodiaCameroonCanadaCaribbean small statesCentral African RepublicCentral Europe and the BalticsChadChileChinaColombiaComorosCongo, Dem. Rep.Congo, Rep.Costa RicaCote d'IvoireCroatiaCubaCyprusCzech RepublicDenmarkDjiboutiDominicaDominican RepublicEarly-demographic dividendEast Asia & PacificEast Asia & Pacific (excluding high income)East Asia & Pacific (IDA & IBRD countries)EcuadorEgypt, Arab Rep.El SalvadorEquatorial GuineaEritreaEstoniaEthiopiaEuro areaEurope & Central AsiaEurope & Central Asia (excluding high income)Europe & Central Asia (IDA & IBRD countries)European UnionFaroe IslandsFijiFinlandFragile and conflict affected situationsFranceFrench PolynesiaGabonGambia, TheGeorgiaGermanyGhanaGreeceGrenadaGuatemalaGuineaGuinea-BissauGuyanaHaitiHeavily indebted poor countries (HIPC)High incomeHondurasHong Kong SAR, ChinaHungaryIBRD onlyIcelandIDA & IBRD totalIDA blendIDA onlyIDA totalIndiaIndonesiaIran, Islamic Rep.IraqIrelandIsraelItalyJamaicaJapanJordanKazakhstanKenyaKiribatiKorea, Rep.KosovoKuwaitKyrgyz RepublicLao PDRLate-demographic dividendLatin America & Caribbean Latin America & Caribbean (excluding high income)Latin America & the Caribbean (IDA & IBRD countries)LatviaLeast developed countries: UN classificationLebanonLesothoLiberiaLibyaLithuaniaLow & middle incomeLow incomeLower middle incomeLuxembourgMacao SAR, ChinaMacedonia, FYRMadagascarMalawiMalaysiaMaldivesMaliMaltaMauritaniaMauritiusMexicoMicronesia, Fed. Sts.Middle East & North AfricaMiddle East & North Africa (excluding high income)Middle East & North Africa (IDA & IBRD countries)Middle incomeMoldovaMongoliaMontenegroMoroccoMozambiqueMyanmarNamibiaNepalNetherlandsNew CaledoniaNew ZealandNicaraguaNigerNigeriaNorth AmericaNorwayOECD membersOmanOther small statesPacific island small statesPakistanPalauPanamaPapua New GuineaParaguayPeruPhilippinesPolandPortugalPost-demographic dividendPre-demographic dividendPuerto RicoQatarRomaniaRussian FederationRwandaSamoaSaudi ArabiaSenegalSerbiaSeychellesSierra LeoneSingaporeSlovak RepublicSloveniaSmall statesSolomon IslandsSomaliaSouth AfricaSouth AsiaSouth Asia (IDA & IBRD)South SudanSpainSri LankaSt. Kitts and NevisSt. LuciaSt. Vincent and the GrenadinesSub-Saharan Africa Sub-Saharan Africa (excluding high income)Sub-Saharan Africa (IDA & IBRD countries)SudanSurinameSwazilandSwedenSwitzerlandSyrian Arab RepublicTajikistanTanzaniaThailandTimor-LesteTogoTongaTrinidad and TobagoTunisiaTurkeyTurkmenistanUgandaUkraineUnited Arab EmiratesUnited KingdomUnited StatesUpper middle incomeUruguayUzbekistanVanuatuVenezuela, RBVietnamWest Bank and GazaWorldYemen, Rep.ZambiaZimbabwe Timeline:
This timeline shows a graph from 1969 to 2016 of Saudi Arabia. No data until 1968. Number of actual observations by date: 48.
Source name:
World Development Indicators
Source organization:
World Bank national accounts data, and OECD National Accounts data files.
Categories, topics:
Economy & Growth, Trade
Last updated:
apr 23, 2017
Indicators value changes by year
Minimum:
1.999 bln
jan 1, 1969
Maximum:
399.42 bln
jan 1, 2013
At the date of observation
Value
Absolute change
Change from previous value
jan 1, 1969
1.999 bln
+1.999 bln
0.0%
jan 1, 1970
2.162 bln
+162.724 mln
8.14%
jan 1, 1971
2.732 bln
+570.073 mln
26.37%
jan 1, 1972
3.879 bln
+1.147 bln
41.98%
jan 1, 1973
5.952 bln
+2.073 bln
53.44%
jan 1, 1974
14.903 bln
+8.952 bln
150.41%
jan 1, 1975
28.581 bln
+13.678 bln
91.78%
jan 1, 1976
34.301 bln
+5.72 bln
20.01%
jan 1, 1977
38.23 bln
+3.93 bln
11.46%
jan 1, 1978
41.11 bln
+2.88 bln
7.53%
jan 1, 1979
39.584 bln
-1.526 bln
-3.71%
jan 1, 1980
61.362 bln
+21.778 bln
55.02%
jan 1, 1981
104.411 bln
+43.049 bln
70.16%
jan 1, 1982
115.77 bln
+11.358 bln
10.88%
jan 1, 1983
77.741 bln
-38.029 bln
-32.85%
jan 1, 1984
49.691 bln
-28.05 bln
-36.08%
jan 1, 1985
41.297 bln
-8.394 bln
-16.89%
jan 1, 1986
31.243 bln
-10.054 bln
-24.34%
jan 1, 1987
23.221 bln
-8.022 bln
-25.68%
jan 1, 1988
26.447 bln
+3.226 bln
13.89%
jan 1, 1989
27.645 bln
+1.198 bln
4.53%
jan 1, 1990
32.175 bln
+4.53 bln
16.38%
jan 1, 1991
47.446 bln
+15.271 bln
47.46%
jan 1, 1992
50.653 bln
+3.207 bln
6.76%
jan 1, 1993
53.611 bln
+2.958 bln
5.84%
jan 1, 1994
45.678 bln
-7.932 bln
-14.8%
jan 1, 1995
45.961 bln
+282.51 mln
0.62%
jan 1, 1996
53.521 bln
+7.56 bln
16.45%
jan 1, 1997
63.501 bln
+9.98 bln
18.65%
jan 1, 1998
64.989 bln
+1.488 bln
2.34%
jan 1, 1999
43.493 bln
-21.496 bln
-33.08%
jan 1, 2000
56.062 bln
+12.569 bln
28.9%
jan 1, 2001
82.259 bln
+26.198 bln
46.73%
jan 1, 2002
72.981 bln
-9.279 bln
-11.28%
jan 1, 2003
77.641 bln
+4.661 bln
6.39%
jan 1, 2004
98.957 bln
+21.315 bln
27.45%
jan 1, 2005
131.921 bln
+32.964 bln
33.31%
jan 1, 2006
187.389 bln
+55.468 bln
42.05%
jan 1, 2007
225.507 bln
+38.118 bln
20.34%
jan 1, 2008
249.318 bln
+23.812 bln
10.56%
jan 1, 2009
322.854 bln
+73.535 bln
29.49%
jan 1, 2010
202.056 bln
-120.797 bln
-37.42%
jan 1, 2011
261.831 bln
+59.775 bln
29.58%
jan 1, 2012
376.224 bln
+114.393 bln
43.69%
jan 1, 2013
399.42 bln
+23.195 bln
6.17%
jan 1, 2014
387.644 bln
-11.776 bln
-2.95%
jan 1, 2015
354.541 bln
-33.103 bln
-8.54%
jan 1, 2016
218.024 bln
-136.517 bln
-38.51%
Ranking of countries by current statistics by years


Comments: