29
/
en
AIzaSyAYiBZKx7MnpbEhh9jyipgxe19OcubqV5w
April 1, 2024
250716
St. Lucia
LCA
true
2
1
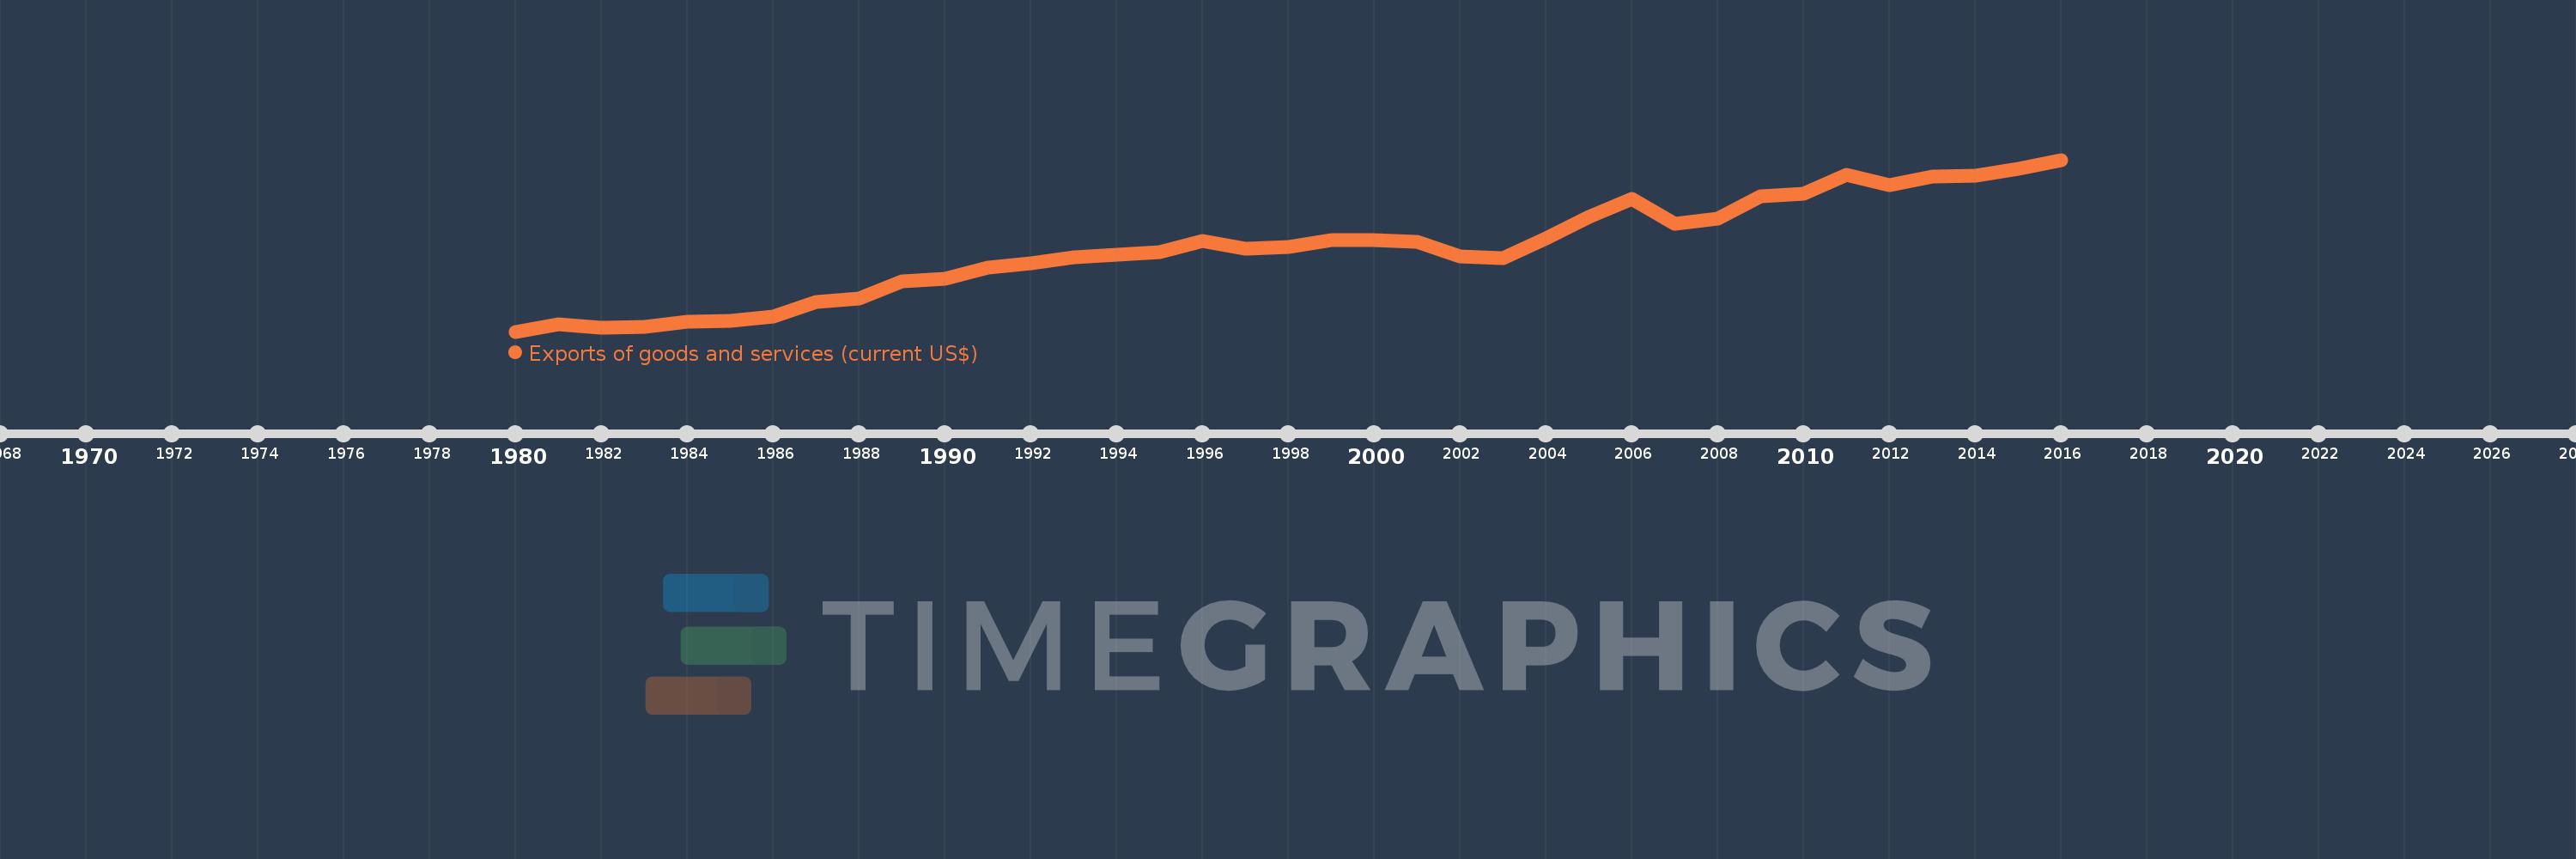
Exports of goods and services (current US$)
2016,2015,2014,2013,2012,2011,2010,2009,2008,2007,2006,2005,2004,2003,2002,2001,2000,1999,1998,1997,1996,1995,1994,1993,1992,1991,1990,1989,1988,1987,1986,1985,1984,1983,1982,1981,1980
This statistics in other country:
AfghanistanAlbaniaAlgeriaAngolaAntigua and BarbudaArab WorldArgentinaArmeniaArubaAustraliaAustriaAzerbaijanBahamas, TheBahrainBangladeshBarbadosBelarusBelgiumBelizeBeninBermudaBhutanBoliviaBosnia and HerzegovinaBotswanaBrazilBrunei DarussalamBulgariaBurkina FasoBurundiCabo VerdeCambodiaCameroonCanadaCaribbean small statesCentral African RepublicCentral Europe and the BalticsChadChileChinaColombiaComorosCongo, Dem. Rep.Congo, Rep.Costa RicaCote d'IvoireCroatiaCubaCyprusCzech RepublicDenmarkDjiboutiDominicaDominican RepublicEarly-demographic dividendEast Asia & PacificEast Asia & Pacific (excluding high income)East Asia & Pacific (IDA & IBRD countries)EcuadorEgypt, Arab Rep.El SalvadorEquatorial GuineaEritreaEstoniaEthiopiaEuro areaEurope & Central AsiaEurope & Central Asia (excluding high income)Europe & Central Asia (IDA & IBRD countries)European UnionFaroe IslandsFijiFinlandFragile and conflict affected situationsFranceFrench PolynesiaGabonGambia, TheGeorgiaGermanyGhanaGreeceGrenadaGuatemalaGuineaGuinea-BissauGuyanaHaitiHeavily indebted poor countries (HIPC)High incomeHondurasHong Kong SAR, ChinaHungaryIBRD onlyIcelandIDA & IBRD totalIDA blendIDA onlyIDA totalIndiaIndonesiaIran, Islamic Rep.IraqIrelandIsraelItalyJamaicaJapanJordanKazakhstanKenyaKiribatiKorea, Rep.KosovoKuwaitKyrgyz RepublicLao PDRLate-demographic dividendLatin America & Caribbean Latin America & Caribbean (excluding high income)Latin America & the Caribbean (IDA & IBRD countries)LatviaLeast developed countries: UN classificationLebanonLesothoLiberiaLibyaLithuaniaLow & middle incomeLow incomeLower middle incomeLuxembourgMacao SAR, ChinaMacedonia, FYRMadagascarMalawiMalaysiaMaldivesMaliMaltaMauritaniaMauritiusMexicoMicronesia, Fed. Sts.Middle East & North AfricaMiddle East & North Africa (excluding high income)Middle East & North Africa (IDA & IBRD countries)Middle incomeMoldovaMongoliaMontenegroMoroccoMozambiqueMyanmarNamibiaNepalNetherlandsNew CaledoniaNew ZealandNicaraguaNigerNigeriaNorth AmericaNorwayOECD membersOmanOther small statesPacific island small statesPakistanPalauPanamaPapua New GuineaParaguayPeruPhilippinesPolandPortugalPost-demographic dividendPre-demographic dividendPuerto RicoQatarRomaniaRussian FederationRwandaSamoaSaudi ArabiaSenegalSerbiaSeychellesSierra LeoneSingaporeSlovak RepublicSloveniaSmall statesSolomon IslandsSomaliaSouth AfricaSouth AsiaSouth Asia (IDA & IBRD)South SudanSpainSri LankaSt. Kitts and NevisSt. LuciaSt. Vincent and the GrenadinesSub-Saharan Africa Sub-Saharan Africa (excluding high income)Sub-Saharan Africa (IDA & IBRD countries)SudanSurinameSwazilandSwedenSwitzerlandSyrian Arab RepublicTajikistanTanzaniaThailandTimor-LesteTogoTongaTrinidad and TobagoTunisiaTurkeyTurkmenistanUgandaUkraineUnited Arab EmiratesUnited KingdomUnited StatesUpper middle incomeUruguayUzbekistanVanuatuVenezuela, RBVietnamWest Bank and GazaWorldYemen, Rep.ZambiaZimbabwe Timeline:
This timeline shows a graph from 1980 to 2016 of St. Lucia. No data until 1979. Number of actual observations by date: 37.
Source name:
World Development Indicators
Source organization:
World Bank national accounts data, and OECD National Accounts data files.
Categories, topics:
Economy & Growth, Trade
Last updated:
apr 23, 2017
Indicators value changes by year
Minimum:
65.296 mln
jan 1, 1980
Maximum:
662.027 mln
jan 1, 2016
At the date of observation
Value
Absolute change
Change from previous value
jan 1, 1980
65.296 mln
+65.296 mln
0.0%
jan 1, 1981
89.33 mln
+24.033 mln
36.81%
jan 1, 1982
78.811 mln
-10.519 mln
-11.77%
jan 1, 1983
82.97 mln
+4.159 mln
5.28%
jan 1, 1984
98.274 mln
+15.304 mln
18.44%
jan 1, 1985
103.752 mln
+5.478 mln
5.57%
jan 1, 1986
116.148 mln
+12.396 mln
11.95%
jan 1, 1987
167.2 mln
+51.052 mln
43.95%
jan 1, 1988
180.704 mln
+13.504 mln
8.08%
jan 1, 1989
239.4 mln
+58.696 mln
32.48%
jan 1, 1990
249.8 mln
+10.4 mln
4.34%
jan 1, 1991
288.2 mln
+38.4 mln
15.37%
jan 1, 1992
301.7 mln
+13.5 mln
4.68%
jan 1, 1993
323.8 mln
+22.1 mln
7.33%
jan 1, 1994
332.9 mln
+9.1 mln
2.81%
jan 1, 1995
340.0 mln
+7.1 mln
2.13%
jan 1, 1996
378.8 mln
+38.8 mln
11.41%
jan 1, 1997
353.111 mln
-25.689 mln
-6.78%
jan 1, 1998
358.67 mln
+5.559 mln
1.57%
jan 1, 1999
384.185 mln
+25.515 mln
7.11%
jan 1, 2000
382.0 mln
-2.185 mln
-0.57%
jan 1, 2001
376.874 mln
-5.126 mln
-1.34%
jan 1, 2002
327.813 mln
-49.061 mln
-13.02%
jan 1, 2003
319.191 mln
-8.621 mln
-2.63%
jan 1, 2004
390.119 mln
+70.928 mln
22.22%
jan 1, 2005
464.235 mln
+74.115 mln
19.0%
jan 1, 2006
524.916 mln
+60.681 mln
13.07%
jan 1, 2007
440.208 mln
-84.708 mln
-16.14%
jan 1, 2008
457.126 mln
+16.918 mln
3.84%
jan 1, 2009
536.059 mln
+78.932 mln
17.27%
jan 1, 2010
543.952 mln
+7.894 mln
1.47%
jan 1, 2011
608.868 mln
+64.916 mln
11.93%
jan 1, 2012
572.842 mln
-36.026 mln
-5.92%
jan 1, 2013
603.761 mln
+30.919 mln
5.4%
jan 1, 2014
607.777 mln
+4.016 mln
0.67%
jan 1, 2015
632.124 mln
+24.346 mln
4.01%
jan 1, 2016
662.027 mln
+29.904 mln
4.73%
Ranking of countries by current statistics by years


Comments: