29
/
en
AIzaSyAYiBZKx7MnpbEhh9jyipgxe19OcubqV5w
April 1, 2024
258271
Syrian Arab Republic
SYR
true
2
1
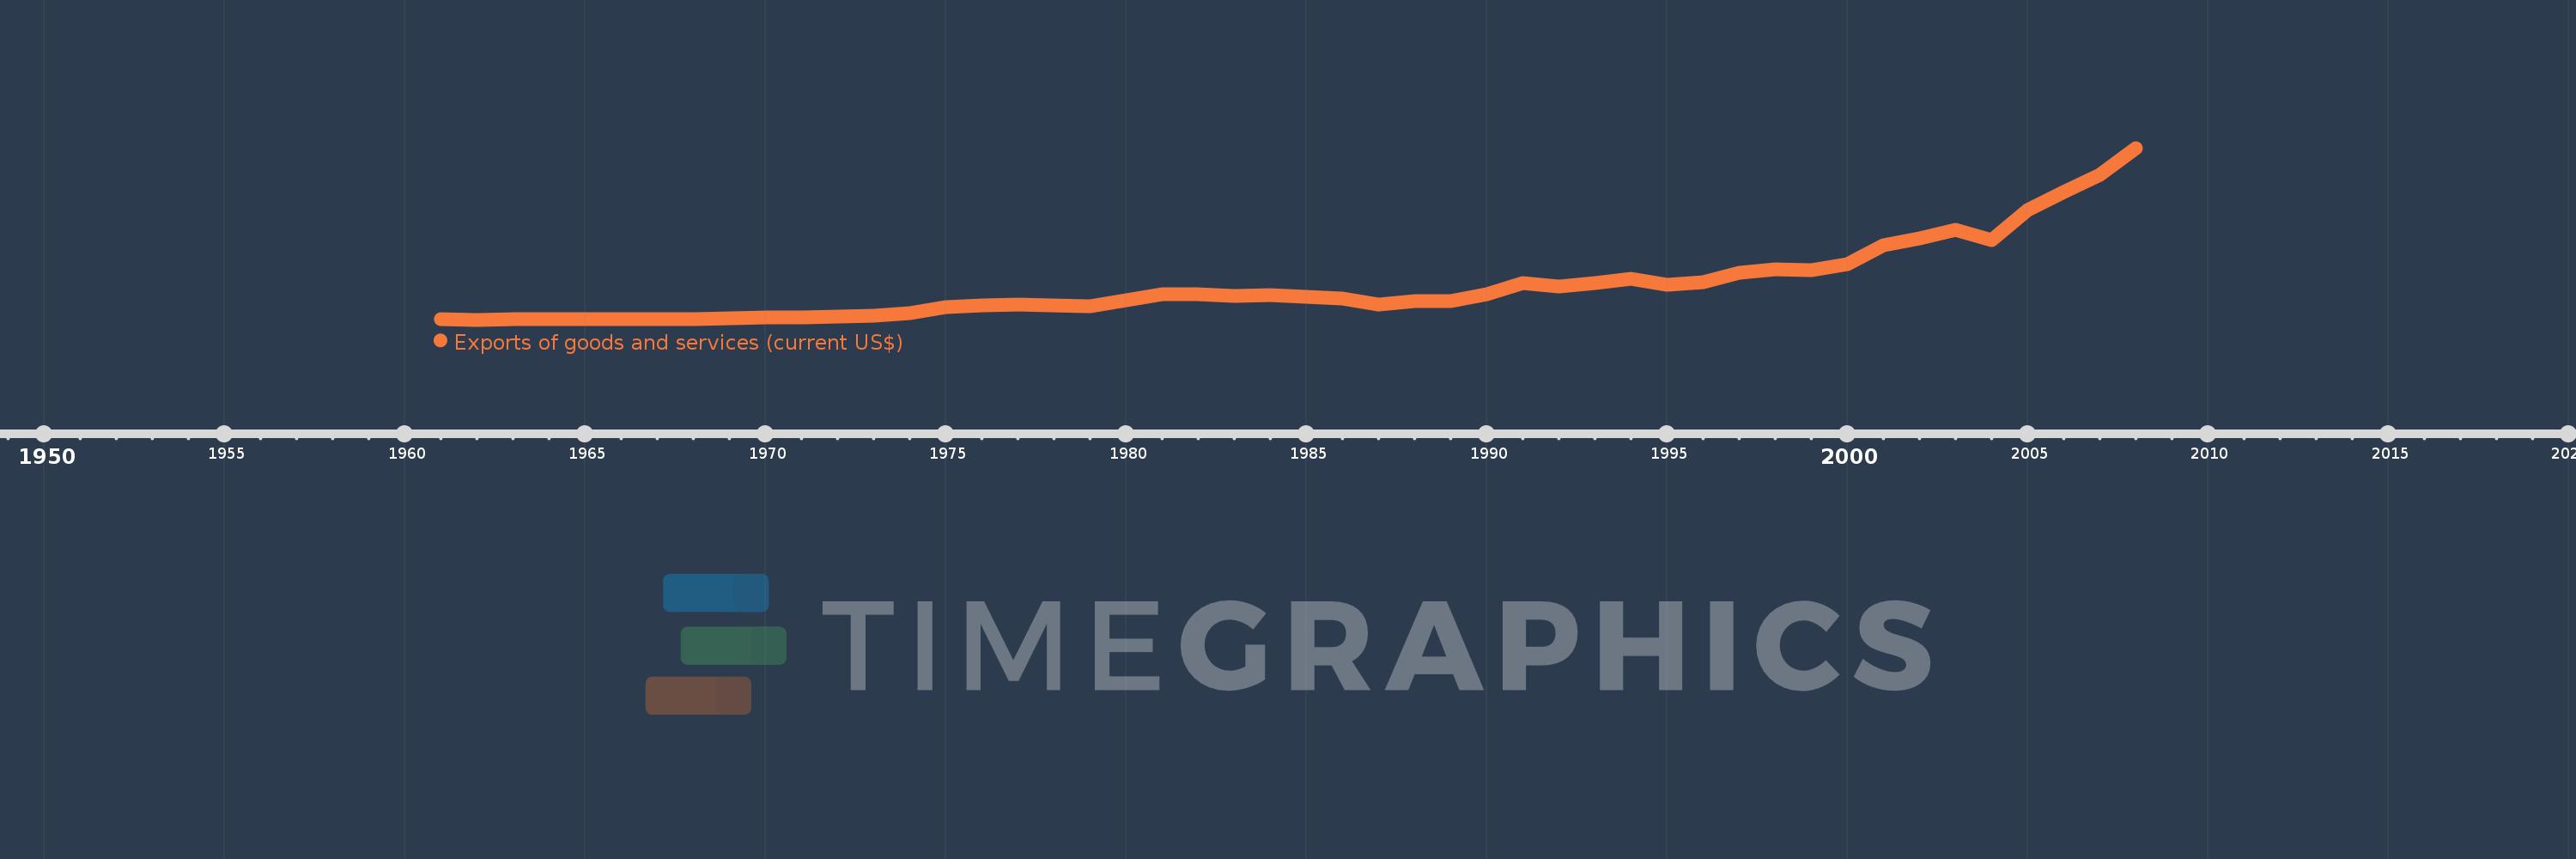
Exports of goods and services (current US$)
2008,2007,2006,2005,2004,2003,2002,2001,2000,1999,1998,1997,1996,1995,1994,1993,1992,1991,1990,1989,1988,1987,1986,1985,1984,1983,1982,1981,1980,1979,1978,1977,1976,1975,1974,1973,1972,1971,1970,1969,1968,1967,1966,1965,1964,1963,1962,1961
This statistics in other country:
AfghanistanAlbaniaAlgeriaAngolaAntigua and BarbudaArab WorldArgentinaArmeniaArubaAustraliaAustriaAzerbaijanBahamas, TheBahrainBangladeshBarbadosBelarusBelgiumBelizeBeninBermudaBhutanBoliviaBosnia and HerzegovinaBotswanaBrazilBrunei DarussalamBulgariaBurkina FasoBurundiCabo VerdeCambodiaCameroonCanadaCaribbean small statesCentral African RepublicCentral Europe and the BalticsChadChileChinaColombiaComorosCongo, Dem. Rep.Congo, Rep.Costa RicaCote d'IvoireCroatiaCubaCyprusCzech RepublicDenmarkDjiboutiDominicaDominican RepublicEarly-demographic dividendEast Asia & PacificEast Asia & Pacific (excluding high income)East Asia & Pacific (IDA & IBRD countries)EcuadorEgypt, Arab Rep.El SalvadorEquatorial GuineaEritreaEstoniaEthiopiaEuro areaEurope & Central AsiaEurope & Central Asia (excluding high income)Europe & Central Asia (IDA & IBRD countries)European UnionFaroe IslandsFijiFinlandFragile and conflict affected situationsFranceFrench PolynesiaGabonGambia, TheGeorgiaGermanyGhanaGreeceGrenadaGuatemalaGuineaGuinea-BissauGuyanaHaitiHeavily indebted poor countries (HIPC)High incomeHondurasHong Kong SAR, ChinaHungaryIBRD onlyIcelandIDA & IBRD totalIDA blendIDA onlyIDA totalIndiaIndonesiaIran, Islamic Rep.IraqIrelandIsraelItalyJamaicaJapanJordanKazakhstanKenyaKiribatiKorea, Rep.KosovoKuwaitKyrgyz RepublicLao PDRLate-demographic dividendLatin America & Caribbean Latin America & Caribbean (excluding high income)Latin America & the Caribbean (IDA & IBRD countries)LatviaLeast developed countries: UN classificationLebanonLesothoLiberiaLibyaLithuaniaLow & middle incomeLow incomeLower middle incomeLuxembourgMacao SAR, ChinaMacedonia, FYRMadagascarMalawiMalaysiaMaldivesMaliMaltaMauritaniaMauritiusMexicoMicronesia, Fed. Sts.Middle East & North AfricaMiddle East & North Africa (excluding high income)Middle East & North Africa (IDA & IBRD countries)Middle incomeMoldovaMongoliaMontenegroMoroccoMozambiqueMyanmarNamibiaNepalNetherlandsNew CaledoniaNew ZealandNicaraguaNigerNigeriaNorth AmericaNorwayOECD membersOmanOther small statesPacific island small statesPakistanPalauPanamaPapua New GuineaParaguayPeruPhilippinesPolandPortugalPost-demographic dividendPre-demographic dividendPuerto RicoQatarRomaniaRussian FederationRwandaSamoaSaudi ArabiaSenegalSerbiaSeychellesSierra LeoneSingaporeSlovak RepublicSloveniaSmall statesSolomon IslandsSomaliaSouth AfricaSouth AsiaSouth Asia (IDA & IBRD)South SudanSpainSri LankaSt. Kitts and NevisSt. LuciaSt. Vincent and the GrenadinesSub-Saharan Africa Sub-Saharan Africa (excluding high income)Sub-Saharan Africa (IDA & IBRD countries)SudanSurinameSwazilandSwedenSwitzerlandSyrian Arab RepublicTajikistanTanzaniaThailandTimor-LesteTogoTongaTrinidad and TobagoTunisiaTurkeyTurkmenistanUgandaUkraineUnited Arab EmiratesUnited KingdomUnited StatesUpper middle incomeUruguayUzbekistanVanuatuVenezuela, RBVietnamWest Bank and GazaWorldYemen, Rep.ZambiaZimbabwe Timeline:
This timeline shows a graph from 1961 to 2008 of Syrian Arab Republic. No data until 1960. Number of actual observations by date: 48.
Source name:
World Development Indicators
Source organization:
World Bank national accounts data, and OECD National Accounts data files.
Categories, topics:
Economy & Growth, Trade
Last updated:
apr 23, 2017
Indicators value changes by year
Minimum:
166.355 mln
jan 1, 1962
Maximum:
15.614 bln
jan 1, 2008
At the date of observation
Value
Absolute change
Change from previous value
jan 1, 1961
183.18 mln
+183.18 mln
0.0%
jan 1, 1962
166.355 mln
-16.825 mln
-9.19%
jan 1, 1963
232.483 mln
+66.129 mln
39.75%
jan 1, 1964
233.219 mln
+735.449K
0.32%
jan 1, 1965
223.809 mln
-9.41 mln
-4.03%
jan 1, 1966
250.836 mln
+27.028 mln
12.08%
jan 1, 1967
237.017 mln
-13.819 mln
-5.51%
jan 1, 1968
248.912 mln
+11.894 mln
5.02%
jan 1, 1969
304.528 mln
+55.617 mln
22.34%
jan 1, 1970
384.128 mln
+79.6 mln
26.14%
jan 1, 1971
382.808 mln
-1.32 mln
-0.34%
jan 1, 1972
459.141 mln
+76.333 mln
19.94%
jan 1, 1973
567.251 mln
+108.111 mln
23.55%
jan 1, 1974
730.241 mln
+162.989 mln
28.73%
jan 1, 1975
1.27 bln
+539.69 mln
73.91%
jan 1, 1976
1.494 bln
+223.607 mln
17.61%
jan 1, 1977
1.523 bln
+29.84 mln
2.0%
jan 1, 1978
1.429 bln
-94.324 mln
-6.19%
jan 1, 1979
1.407 bln
-21.901 mln
-1.53%
jan 1, 1980
1.942 bln
+534.779 mln
38.0%
jan 1, 1981
2.433 bln
+491.341 mln
25.3%
jan 1, 1982
2.481 bln
+47.768 mln
1.96%
jan 1, 1983
2.318 bln
-163.111 mln
-6.57%
jan 1, 1984
2.383 bln
+64.646 mln
2.79%
jan 1, 1985
2.222 bln
-160.267 mln
-6.73%
jan 1, 1986
2.064 bln
-158.606 mln
-7.14%
jan 1, 1987
1.53 bln
-533.474 mln
-25.85%
jan 1, 1988
1.818 bln
+287.581 mln
18.79%
jan 1, 1989
1.813 bln
-4.322 mln
-0.24%
jan 1, 1990
2.439 bln
+625.672 mln
34.5%
jan 1, 1991
3.488 bln
+1.049 bln
43.01%
jan 1, 1992
3.168 bln
-319.915 mln
-9.17%
jan 1, 1993
3.48 bln
+311.671 mln
9.84%
jan 1, 1994
3.816 bln
+336.497 mln
9.67%
jan 1, 1995
3.347 bln
-469.879 mln
-12.31%
jan 1, 1996
3.538 bln
+190.965 mln
5.71%
jan 1, 1997
4.389 bln
+851.158 mln
24.06%
jan 1, 1998
4.703 bln
+314.042 mln
7.16%
jan 1, 1999
4.641 bln
-62.012 mln
-1.32%
jan 1, 2000
5.13 bln
+489.23 mln
10.54%
jan 1, 2001
6.839 bln
+1.709 bln
33.32%
jan 1, 2002
7.465 bln
+625.407 mln
9.14%
jan 1, 2003
8.217 bln
+752.054 mln
10.07%
jan 1, 2004
7.306 bln
-910.801 mln
-11.08%
jan 1, 2005
10.048 bln
+2.742 bln
37.54%
jan 1, 2006
11.656 bln
+1.607 bln
15.99%
jan 1, 2007
13.168 bln
+1.512 bln
12.98%
jan 1, 2008
15.614 bln
+2.446 bln
18.57%
Ranking of countries by current statistics by years


Comments: