29
/
en
AIzaSyAYiBZKx7MnpbEhh9jyipgxe19OcubqV5w
April 1, 2024
238211
Seychelles
SYC
true
2
1
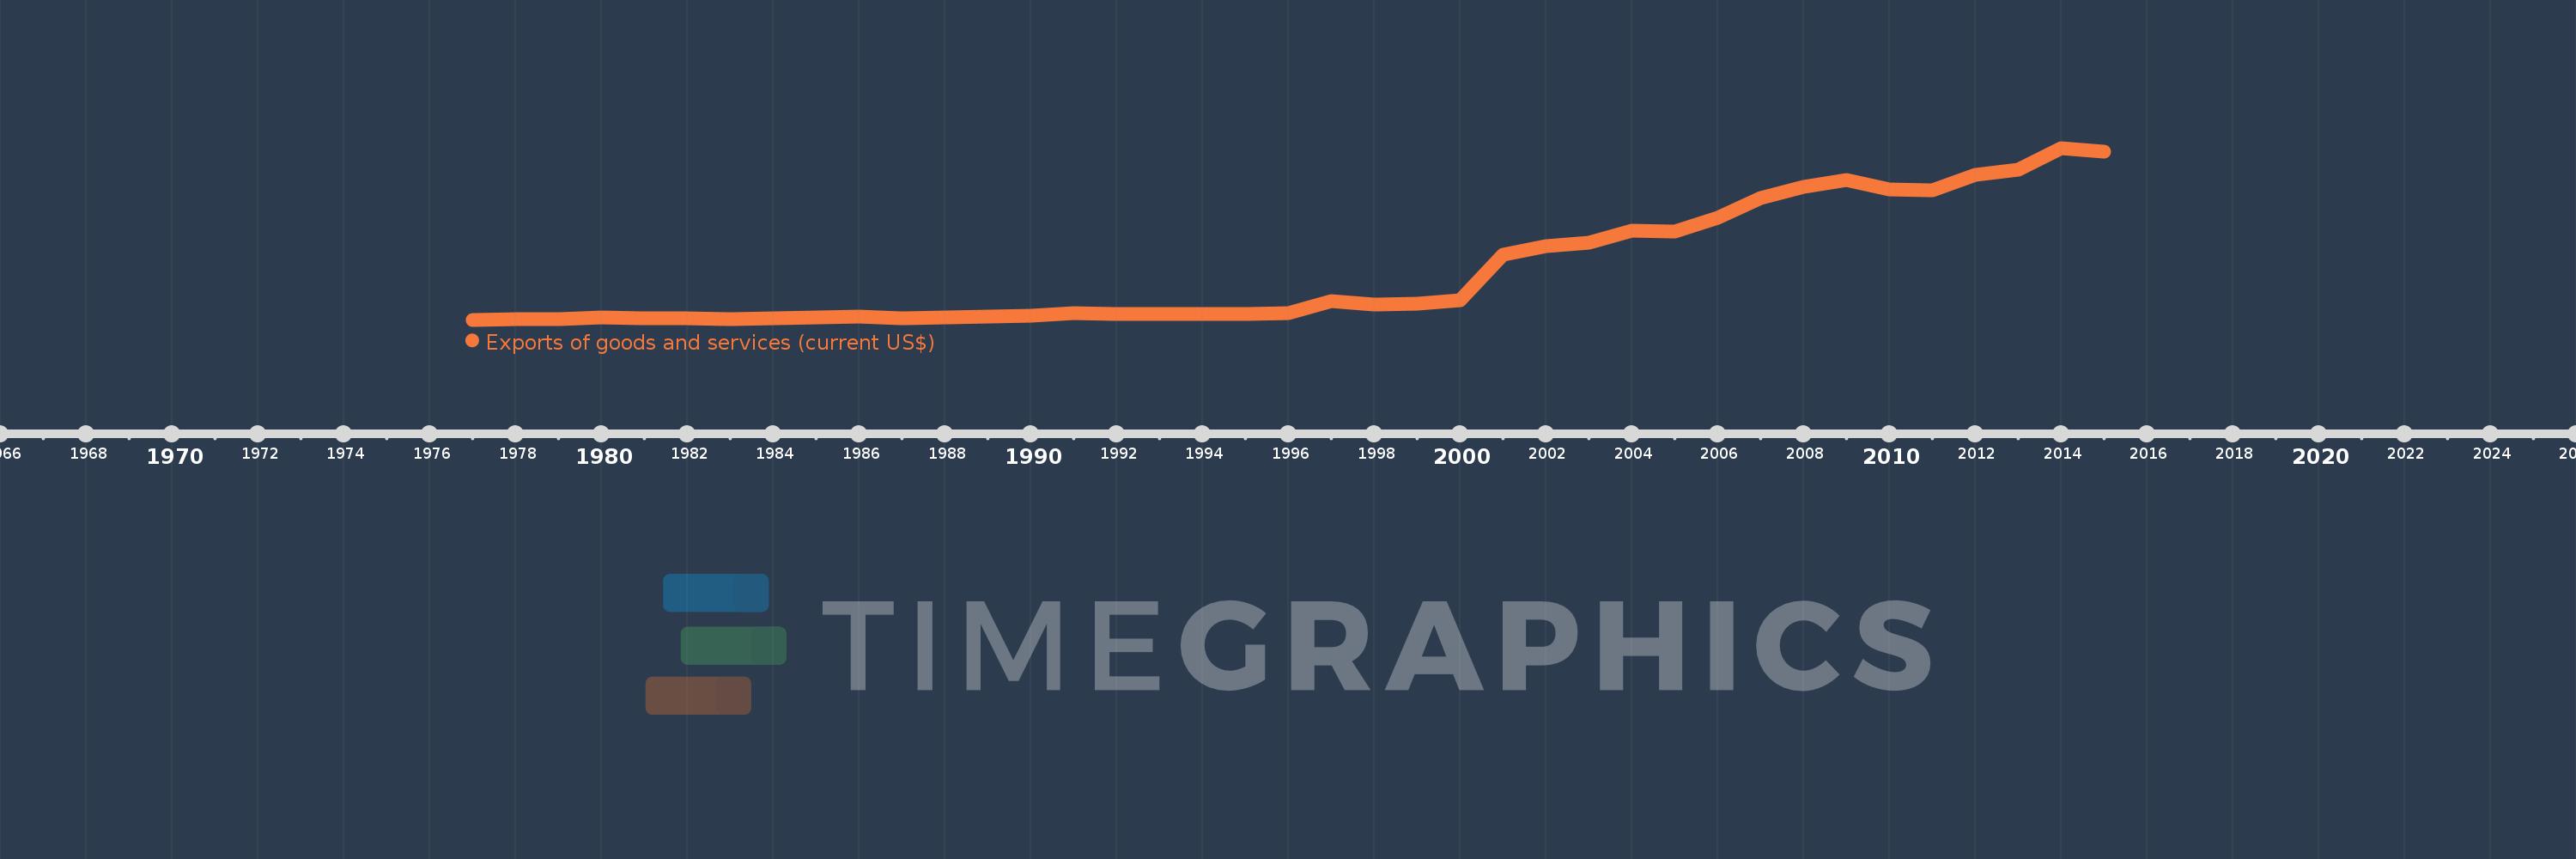
Exports of goods and services (current US$)
2015,2014,2013,2012,2011,2010,2009,2008,2007,2006,2005,2004,2003,2002,2001,2000,1999,1998,1997,1996,1995,1994,1993,1992,1991,1990,1989,1988,1987,1986,1985,1984,1983,1982,1981,1980,1979,1978,1977
This statistics in other country:
AfghanistanAlbaniaAlgeriaAngolaAntigua and BarbudaArab WorldArgentinaArmeniaArubaAustraliaAustriaAzerbaijanBahamas, TheBahrainBangladeshBarbadosBelarusBelgiumBelizeBeninBermudaBhutanBoliviaBosnia and HerzegovinaBotswanaBrazilBrunei DarussalamBulgariaBurkina FasoBurundiCabo VerdeCambodiaCameroonCanadaCaribbean small statesCentral African RepublicCentral Europe and the BalticsChadChileChinaColombiaComorosCongo, Dem. Rep.Congo, Rep.Costa RicaCote d'IvoireCroatiaCubaCyprusCzech RepublicDenmarkDjiboutiDominicaDominican RepublicEarly-demographic dividendEast Asia & PacificEast Asia & Pacific (excluding high income)East Asia & Pacific (IDA & IBRD countries)EcuadorEgypt, Arab Rep.El SalvadorEquatorial GuineaEritreaEstoniaEthiopiaEuro areaEurope & Central AsiaEurope & Central Asia (excluding high income)Europe & Central Asia (IDA & IBRD countries)European UnionFaroe IslandsFijiFinlandFragile and conflict affected situationsFranceFrench PolynesiaGabonGambia, TheGeorgiaGermanyGhanaGreeceGrenadaGuatemalaGuineaGuinea-BissauGuyanaHaitiHeavily indebted poor countries (HIPC)High incomeHondurasHong Kong SAR, ChinaHungaryIBRD onlyIcelandIDA & IBRD totalIDA blendIDA onlyIDA totalIndiaIndonesiaIran, Islamic Rep.IraqIrelandIsraelItalyJamaicaJapanJordanKazakhstanKenyaKiribatiKorea, Rep.KosovoKuwaitKyrgyz RepublicLao PDRLate-demographic dividendLatin America & Caribbean Latin America & Caribbean (excluding high income)Latin America & the Caribbean (IDA & IBRD countries)LatviaLeast developed countries: UN classificationLebanonLesothoLiberiaLibyaLithuaniaLow & middle incomeLow incomeLower middle incomeLuxembourgMacao SAR, ChinaMacedonia, FYRMadagascarMalawiMalaysiaMaldivesMaliMaltaMauritaniaMauritiusMexicoMicronesia, Fed. Sts.Middle East & North AfricaMiddle East & North Africa (excluding high income)Middle East & North Africa (IDA & IBRD countries)Middle incomeMoldovaMongoliaMontenegroMoroccoMozambiqueMyanmarNamibiaNepalNetherlandsNew CaledoniaNew ZealandNicaraguaNigerNigeriaNorth AmericaNorwayOECD membersOmanOther small statesPacific island small statesPakistanPalauPanamaPapua New GuineaParaguayPeruPhilippinesPolandPortugalPost-demographic dividendPre-demographic dividendPuerto RicoQatarRomaniaRussian FederationRwandaSamoaSaudi ArabiaSenegalSerbiaSeychellesSierra LeoneSingaporeSlovak RepublicSloveniaSmall statesSolomon IslandsSomaliaSouth AfricaSouth AsiaSouth Asia (IDA & IBRD)South SudanSpainSri LankaSt. Kitts and NevisSt. LuciaSt. Vincent and the GrenadinesSub-Saharan Africa Sub-Saharan Africa (excluding high income)Sub-Saharan Africa (IDA & IBRD countries)SudanSurinameSwazilandSwedenSwitzerlandSyrian Arab RepublicTajikistanTanzaniaThailandTimor-LesteTogoTongaTrinidad and TobagoTunisiaTurkeyTurkmenistanUgandaUkraineUnited Arab EmiratesUnited KingdomUnited StatesUpper middle incomeUruguayUzbekistanVanuatuVenezuela, RBVietnamWest Bank and GazaWorldYemen, Rep.ZambiaZimbabwe Timeline:
This timeline shows a graph from 1977 to 2015 of Seychelles. No data until 1976. Number of actual observations by date: 39.
Source name:
World Development Indicators
Source organization:
World Bank national accounts data, and OECD National Accounts data files.
Categories, topics:
Economy & Growth, Trade
Last updated:
apr 23, 2017
Indicators value changes by year
Minimum:
8.673 mln
jan 1, 1977
Maximum:
1.206 bln
jan 1, 2014
At the date of observation
Value
Absolute change
Change from previous value
jan 1, 1977
8.673 mln
+8.673 mln
0.0%
jan 1, 1978
11.089 mln
+2.416 mln
27.86%
jan 1, 1979
15.165 mln
+4.075 mln
36.75%
jan 1, 1980
21.89 mln
+6.726 mln
44.35%
jan 1, 1981
21.153 mln
-737.191K
-3.37%
jan 1, 1982
17.156 mln
-3.997 mln
-18.9%
jan 1, 1983
15.274 mln
-1.882 mln
-10.97%
jan 1, 1984
20.28 mln
+5.006 mln
32.77%
jan 1, 1985
25.708 mln
+5.428 mln
26.77%
jan 1, 1986
27.99 mln
+2.282 mln
8.88%
jan 1, 1987
18.4 mln
-9.59 mln
-34.26%
jan 1, 1988
22.156 mln
+3.756 mln
20.41%
jan 1, 1989
31.824 mln
+9.668 mln
43.64%
jan 1, 1990
34.277 mln
+2.453 mln
7.71%
jan 1, 1991
56.494 mln
+22.217 mln
64.82%
jan 1, 1992
48.829 mln
-7.666 mln
-13.57%
jan 1, 1993
47.963 mln
-865.902K
-1.77%
jan 1, 1994
51.148 mln
+3.185 mln
6.64%
jan 1, 1995
50.571 mln
-577.105K
-1.13%
jan 1, 1996
53.236 mln
+2.665 mln
5.27%
jan 1, 1997
139.525 mln
+86.289 mln
162.09%
jan 1, 1998
113.25 mln
-26.274 mln
-18.83%
jan 1, 1999
122.321 mln
+9.071 mln
8.01%
jan 1, 2000
145.086 mln
+22.765 mln
18.61%
jan 1, 2001
464.069 mln
+318.983 mln
219.86%
jan 1, 2002
521.402 mln
+57.333 mln
12.35%
jan 1, 2003
543.132 mln
+21.73 mln
4.17%
jan 1, 2004
627.256 mln
+84.123 mln
15.49%
jan 1, 2005
621.181 mln
-6.075 mln
-0.97%
jan 1, 2006
719.67 mln
+98.489 mln
15.86%
jan 1, 2007
857.525 mln
+137.855 mln
19.16%
jan 1, 2008
936.671 mln
+79.146 mln
9.23%
jan 1, 2009
980.669 mln
+43.998 mln
4.7%
jan 1, 2010
915.142 mln
-65.527 mln
-6.68%
jan 1, 2011
909.789 mln
-5.353 mln
-0.58%
jan 1, 2012
1.021 bln
+110.944 mln
12.19%
jan 1, 2013
1.052 bln
+31.676 mln
3.1%
jan 1, 2014
1.206 bln
+153.676 mln
14.6%
jan 1, 2015
1.182 bln
-24.045 mln
-1.99%
Ranking of countries by current statistics by years


Comments: