29
/
en
AIzaSyAYiBZKx7MnpbEhh9jyipgxe19OcubqV5w
April 1, 2024
47076
Lower middle income
LMC
false
2
1
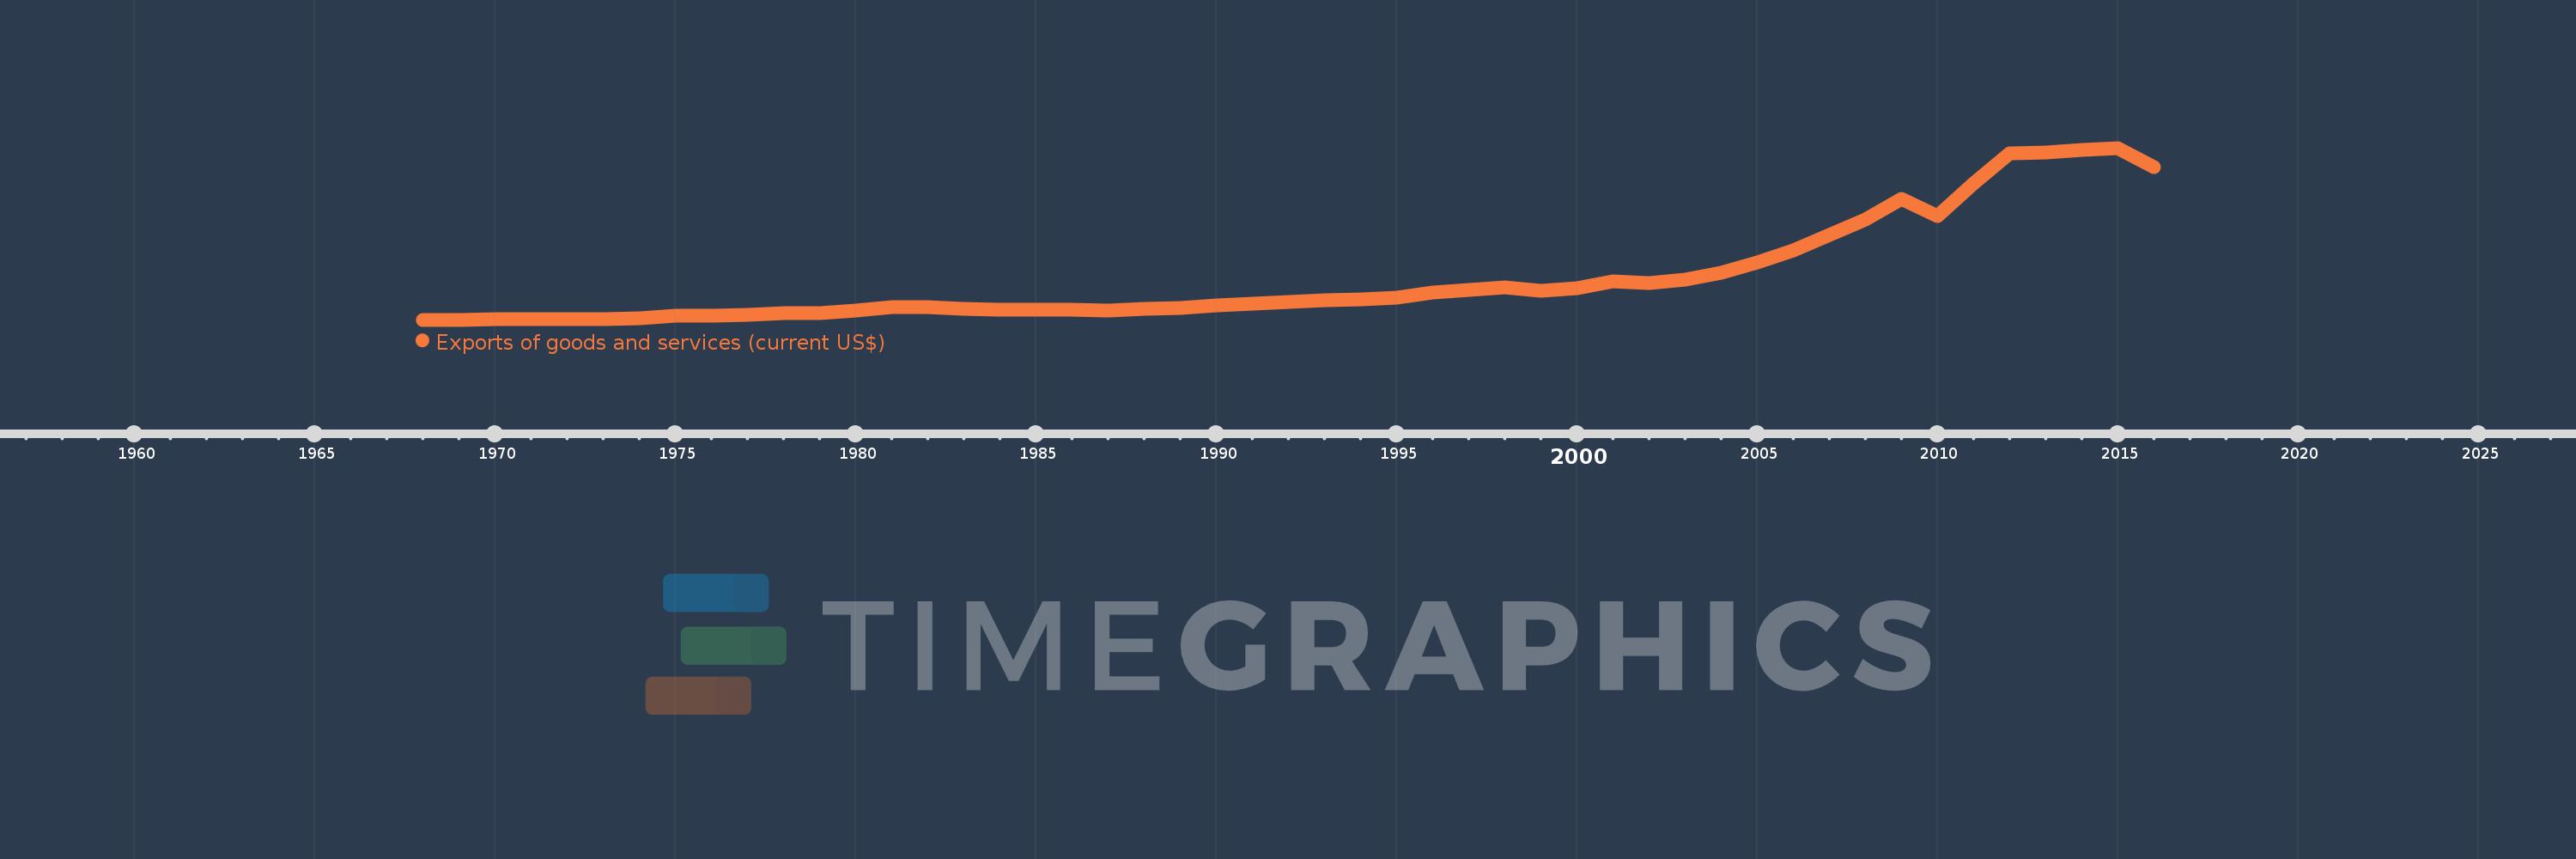
Exports of goods and services (current US$)
2016,2015,2014,2013,2012,2011,2010,2009,2008,2007,2006,2005,2004,2003,2002,2001,2000,1999,1998,1997,1996,1995,1994,1993,1992,1991,1990,1989,1988,1987,1986,1985,1984,1983,1982,1981,1980,1979,1978,1977,1976,1975,1974,1973,1972,1971,1970,1969,1968
This statistics in other country:
AfghanistanAlbaniaAlgeriaAngolaAntigua and BarbudaArab WorldArgentinaArmeniaArubaAustraliaAustriaAzerbaijanBahamas, TheBahrainBangladeshBarbadosBelarusBelgiumBelizeBeninBermudaBhutanBoliviaBosnia and HerzegovinaBotswanaBrazilBrunei DarussalamBulgariaBurkina FasoBurundiCabo VerdeCambodiaCameroonCanadaCaribbean small statesCentral African RepublicCentral Europe and the BalticsChadChileChinaColombiaComorosCongo, Dem. Rep.Congo, Rep.Costa RicaCote d'IvoireCroatiaCubaCyprusCzech RepublicDenmarkDjiboutiDominicaDominican RepublicEarly-demographic dividendEast Asia & PacificEast Asia & Pacific (excluding high income)East Asia & Pacific (IDA & IBRD countries)EcuadorEgypt, Arab Rep.El SalvadorEquatorial GuineaEritreaEstoniaEthiopiaEuro areaEurope & Central AsiaEurope & Central Asia (excluding high income)Europe & Central Asia (IDA & IBRD countries)European UnionFaroe IslandsFijiFinlandFragile and conflict affected situationsFranceFrench PolynesiaGabonGambia, TheGeorgiaGermanyGhanaGreeceGrenadaGuatemalaGuineaGuinea-BissauGuyanaHaitiHeavily indebted poor countries (HIPC)High incomeHondurasHong Kong SAR, ChinaHungaryIBRD onlyIcelandIDA & IBRD totalIDA blendIDA onlyIDA totalIndiaIndonesiaIran, Islamic Rep.IraqIrelandIsraelItalyJamaicaJapanJordanKazakhstanKenyaKiribatiKorea, Rep.KosovoKuwaitKyrgyz RepublicLao PDRLate-demographic dividendLatin America & Caribbean Latin America & Caribbean (excluding high income)Latin America & the Caribbean (IDA & IBRD countries)LatviaLeast developed countries: UN classificationLebanonLesothoLiberiaLibyaLithuaniaLow & middle incomeLow incomeLower middle incomeLuxembourgMacao SAR, ChinaMacedonia, FYRMadagascarMalawiMalaysiaMaldivesMaliMaltaMauritaniaMauritiusMexicoMicronesia, Fed. Sts.Middle East & North AfricaMiddle East & North Africa (excluding high income)Middle East & North Africa (IDA & IBRD countries)Middle incomeMoldovaMongoliaMontenegroMoroccoMozambiqueMyanmarNamibiaNepalNetherlandsNew CaledoniaNew ZealandNicaraguaNigerNigeriaNorth AmericaNorwayOECD membersOmanOther small statesPacific island small statesPakistanPalauPanamaPapua New GuineaParaguayPeruPhilippinesPolandPortugalPost-demographic dividendPre-demographic dividendPuerto RicoQatarRomaniaRussian FederationRwandaSamoaSaudi ArabiaSenegalSerbiaSeychellesSierra LeoneSingaporeSlovak RepublicSloveniaSmall statesSolomon IslandsSomaliaSouth AfricaSouth AsiaSouth Asia (IDA & IBRD)South SudanSpainSri LankaSt. Kitts and NevisSt. LuciaSt. Vincent and the GrenadinesSub-Saharan Africa Sub-Saharan Africa (excluding high income)Sub-Saharan Africa (IDA & IBRD countries)SudanSurinameSwazilandSwedenSwitzerlandSyrian Arab RepublicTajikistanTanzaniaThailandTimor-LesteTogoTongaTrinidad and TobagoTunisiaTurkeyTurkmenistanUgandaUkraineUnited Arab EmiratesUnited KingdomUnited StatesUpper middle incomeUruguayUzbekistanVanuatuVenezuela, RBVietnamWest Bank and GazaWorldYemen, Rep.ZambiaZimbabwe Timeline:
This timeline shows a graph from 1968 to 2016 of Lower middle income. No data until 1967. Number of actual observations by date: 49.
Source name:
World Development Indicators
Source organization:
World Bank national accounts data, and OECD National Accounts data files.
Categories, topics:
Economy & Growth, Trade
Last updated:
apr 23, 2017
Indicators value changes by year
Minimum:
13.322 bln
jan 1, 1968
Maximum:
1.508 trl
jan 1, 2015
At the date of observation
Value
Absolute change
Change from previous value
jan 1, 1968
13.322 bln
+13.322 bln
0.0%
jan 1, 1969
14.273 bln
+951.135 mln
7.14%
jan 1, 1970
15.23 bln
+957.372 mln
6.71%
jan 1, 1971
17.72 bln
+2.49 bln
16.35%
jan 1, 1972
18.133 bln
+413.166 mln
2.33%
jan 1, 1973
21.433 bln
+3.3 bln
18.2%
jan 1, 1974
29.483 bln
+8.049 bln
37.56%
jan 1, 1975
48.577 bln
+19.095 bln
64.77%
jan 1, 1976
48.308 bln
-269.361 mln
-0.55%
jan 1, 1977
56.822 bln
+8.514 bln
17.62%
jan 1, 1978
68.868 bln
+12.046 bln
21.2%
jan 1, 1979
69.707 bln
+839.313 mln
1.22%
jan 1, 1980
92.962 bln
+23.255 bln
33.36%
jan 1, 1981
126.319 bln
+33.357 bln
35.88%
jan 1, 1982
121.342 bln
-4.977 bln
-3.94%
jan 1, 1983
108.943 bln
-12.399 bln
-10.22%
jan 1, 1984
102.933 bln
-6.01 bln
-5.52%
jan 1, 1985
104.093 bln
+1.159 bln
1.13%
jan 1, 1986
99.124 bln
-4.968 bln
-4.77%
jan 1, 1987
93.338 bln
-5.786 bln
-5.84%
jan 1, 1988
107.958 bln
+14.62 bln
15.66%
jan 1, 1989
118.618 bln
+10.66 bln
9.87%
jan 1, 1990
137.752 bln
+19.134 bln
16.13%
jan 1, 1991
154.902 bln
+17.15 bln
12.45%
jan 1, 1992
168.238 bln
+13.335 bln
8.61%
jan 1, 1993
182.829 bln
+14.591 bln
8.67%
jan 1, 1994
186.946 bln
+4.117 bln
2.25%
jan 1, 1995
205.58 bln
+18.634 bln
9.97%
jan 1, 1996
251.211 bln
+45.631 bln
22.2%
jan 1, 1997
272.51 bln
+21.299 bln
8.48%
jan 1, 1998
292.898 bln
+20.387 bln
7.48%
jan 1, 1999
268.501 bln
-24.397 bln
-8.33%
jan 1, 2000
285.16 bln
+16.659 bln
6.2%
jan 1, 2001
344.299 bln
+59.139 bln
20.74%
jan 1, 2002
335.878 bln
-8.42 bln
-2.45%
jan 1, 2003
362.131 bln
+26.253 bln
7.82%
jan 1, 2004
419.433 bln
+57.302 bln
15.82%
jan 1, 2005
513.375 bln
+93.941 bln
22.4%
jan 1, 2006
616.384 bln
+103.009 bln
20.07%
jan 1, 2007
754.865 bln
+138.482 bln
22.47%
jan 1, 2008
884.743 bln
+129.877 bln
17.21%
jan 1, 2009
1.066 trl
+181.041 bln
20.46%
jan 1, 2010
911.898 bln
-153.885 bln
-14.44%
jan 1, 2011
1.197 trl
+284.625 bln
31.21%
jan 1, 2012
1.46 trl
+263.043 bln
21.98%
jan 1, 2013
1.472 trl
+12.846 bln
0.88%
jan 1, 2014
1.492 trl
+19.534 bln
1.33%
jan 1, 2015
1.508 trl
+16.427 bln
1.1%
jan 1, 2016
1.34 trl
-168.047 bln
-11.14%
Ranking of countries by current statistics by years


Comments: