29
/
en
AIzaSyAYiBZKx7MnpbEhh9jyipgxe19OcubqV5w
April 1, 2024
113516
Cote d'Ivoire
CIV
true
2
1
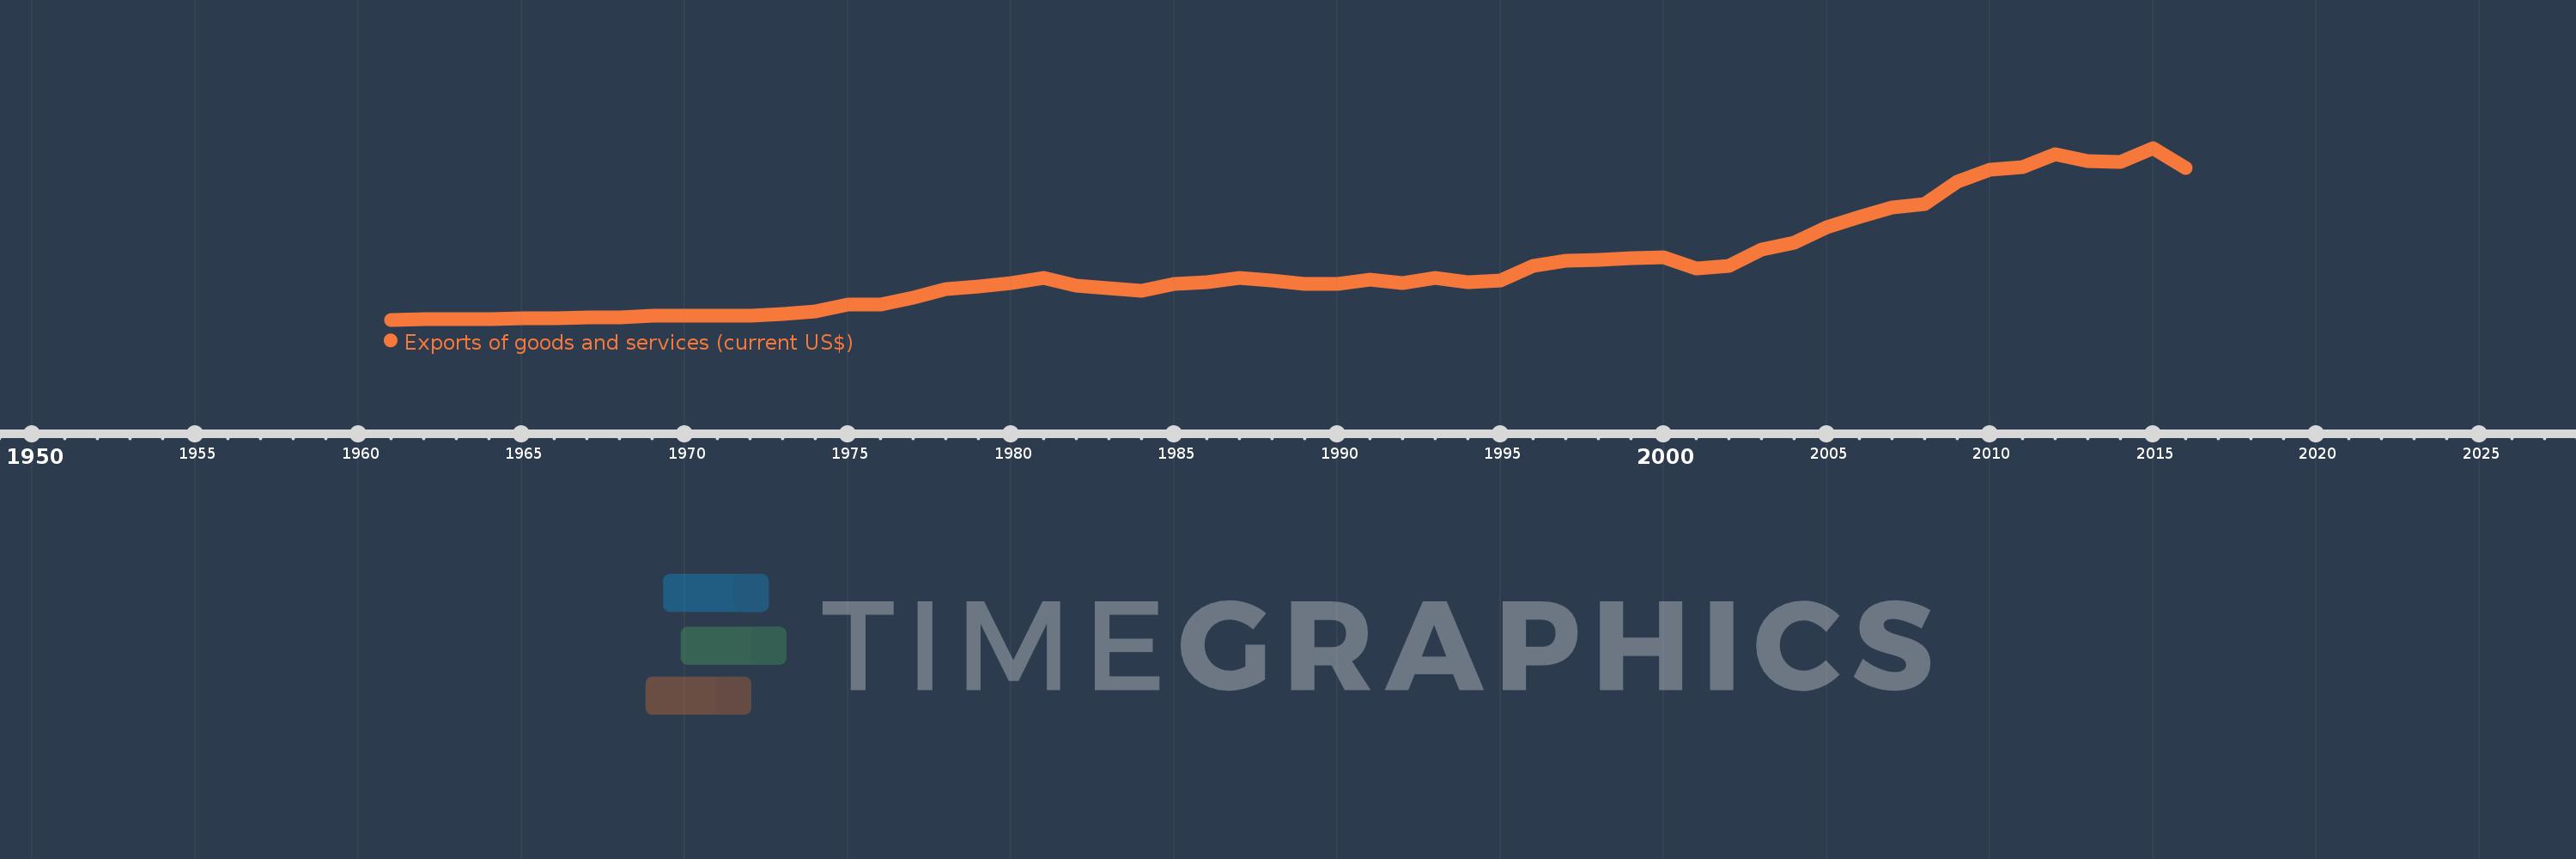
Exports of goods and services (current US$)
2016,2015,2014,2013,2012,2011,2010,2009,2008,2007,2006,2005,2004,2003,2002,2001,2000,1999,1998,1997,1996,1995,1994,1993,1992,1991,1990,1989,1988,1987,1986,1985,1984,1983,1982,1981,1980,1979,1978,1977,1976,1975,1974,1973,1972,1971,1970,1969,1968,1967,1966,1965,1964,1963,1962,1961
This statistics in other country:
AfghanistanAlbaniaAlgeriaAngolaAntigua and BarbudaArab WorldArgentinaArmeniaArubaAustraliaAustriaAzerbaijanBahamas, TheBahrainBangladeshBarbadosBelarusBelgiumBelizeBeninBermudaBhutanBoliviaBosnia and HerzegovinaBotswanaBrazilBrunei DarussalamBulgariaBurkina FasoBurundiCabo VerdeCambodiaCameroonCanadaCaribbean small statesCentral African RepublicCentral Europe and the BalticsChadChileChinaColombiaComorosCongo, Dem. Rep.Congo, Rep.Costa RicaCote d'IvoireCroatiaCubaCyprusCzech RepublicDenmarkDjiboutiDominicaDominican RepublicEarly-demographic dividendEast Asia & PacificEast Asia & Pacific (excluding high income)East Asia & Pacific (IDA & IBRD countries)EcuadorEgypt, Arab Rep.El SalvadorEquatorial GuineaEritreaEstoniaEthiopiaEuro areaEurope & Central AsiaEurope & Central Asia (excluding high income)Europe & Central Asia (IDA & IBRD countries)European UnionFaroe IslandsFijiFinlandFragile and conflict affected situationsFranceFrench PolynesiaGabonGambia, TheGeorgiaGermanyGhanaGreeceGrenadaGuatemalaGuineaGuinea-BissauGuyanaHaitiHeavily indebted poor countries (HIPC)High incomeHondurasHong Kong SAR, ChinaHungaryIBRD onlyIcelandIDA & IBRD totalIDA blendIDA onlyIDA totalIndiaIndonesiaIran, Islamic Rep.IraqIrelandIsraelItalyJamaicaJapanJordanKazakhstanKenyaKiribatiKorea, Rep.KosovoKuwaitKyrgyz RepublicLao PDRLate-demographic dividendLatin America & Caribbean Latin America & Caribbean (excluding high income)Latin America & the Caribbean (IDA & IBRD countries)LatviaLeast developed countries: UN classificationLebanonLesothoLiberiaLibyaLithuaniaLow & middle incomeLow incomeLower middle incomeLuxembourgMacao SAR, ChinaMacedonia, FYRMadagascarMalawiMalaysiaMaldivesMaliMaltaMauritaniaMauritiusMexicoMicronesia, Fed. Sts.Middle East & North AfricaMiddle East & North Africa (excluding high income)Middle East & North Africa (IDA & IBRD countries)Middle incomeMoldovaMongoliaMontenegroMoroccoMozambiqueMyanmarNamibiaNepalNetherlandsNew CaledoniaNew ZealandNicaraguaNigerNigeriaNorth AmericaNorwayOECD membersOmanOther small statesPacific island small statesPakistanPalauPanamaPapua New GuineaParaguayPeruPhilippinesPolandPortugalPost-demographic dividendPre-demographic dividendPuerto RicoQatarRomaniaRussian FederationRwandaSamoaSaudi ArabiaSenegalSerbiaSeychellesSierra LeoneSingaporeSlovak RepublicSloveniaSmall statesSolomon IslandsSomaliaSouth AfricaSouth AsiaSouth Asia (IDA & IBRD)South SudanSpainSri LankaSt. Kitts and NevisSt. LuciaSt. Vincent and the GrenadinesSub-Saharan Africa Sub-Saharan Africa (excluding high income)Sub-Saharan Africa (IDA & IBRD countries)SudanSurinameSwazilandSwedenSwitzerlandSyrian Arab RepublicTajikistanTanzaniaThailandTimor-LesteTogoTongaTrinidad and TobagoTunisiaTurkeyTurkmenistanUgandaUkraineUnited Arab EmiratesUnited KingdomUnited StatesUpper middle incomeUruguayUzbekistanVanuatuVenezuela, RBVietnamWest Bank and GazaWorldYemen, Rep.ZambiaZimbabwe Timeline:
This timeline shows a graph from 1961 to 2016 of Cote d'Ivoire. No data until 1960. Number of actual observations by date: 56.
Source name:
World Development Indicators
Source organization:
World Bank national accounts data, and OECD National Accounts data files.
Categories, topics:
Economy & Growth, Trade
Last updated:
apr 23, 2017
Indicators value changes by year
Minimum:
187.018 mln
jan 1, 1961
Maximum:
14.142 bln
jan 1, 2015
At the date of observation
Value
Absolute change
Change from previous value
jan 1, 1961
187.018 mln
+187.018 mln
0.0%
jan 1, 1962
218.194 mln
+31.177 mln
16.67%
jan 1, 1963
221.93 mln
+3.736 mln
1.71%
jan 1, 1964
258.265 mln
+36.335 mln
16.37%
jan 1, 1965
330.533 mln
+72.268 mln
27.98%
jan 1, 1966
338.691 mln
+8.158 mln
2.47%
jan 1, 1967
372.845 mln
+34.154 mln
10.08%
jan 1, 1968
392.275 mln
+19.43 mln
5.21%
jan 1, 1969
521.48 mln
+129.205 mln
32.94%
jan 1, 1970
500.46 mln
-21.019 mln
-4.03%
jan 1, 1971
520.616 mln
+20.156 mln
4.03%
jan 1, 1972
510.248 mln
-10.369 mln
-1.99%
jan 1, 1973
619.773 mln
+109.526 mln
21.47%
jan 1, 1974
896.858 mln
+277.085 mln
44.71%
jan 1, 1975
1.403 bln
+506.106 mln
56.43%
jan 1, 1976
1.43 bln
+27.188 mln
1.94%
jan 1, 1977
1.946 bln
+515.858 mln
36.07%
jan 1, 1978
2.671 bln
+724.541 mln
37.23%
jan 1, 1979
2.885 bln
+214.816 mln
8.04%
jan 1, 1980
3.164 bln
+278.393 mln
9.65%
jan 1, 1981
3.562 bln
+397.872 mln
12.58%
jan 1, 1982
2.966 bln
-595.468 mln
-16.72%
jan 1, 1983
2.756 bln
-209.978 mln
-7.08%
jan 1, 1984
2.527 bln
-228.802 mln
-8.3%
jan 1, 1985
3.1 bln
+572.695 mln
22.66%
jan 1, 1986
3.264 bln
+163.711 mln
5.28%
jan 1, 1987
3.617 bln
+353.365 mln
10.83%
jan 1, 1988
3.372 bln
-244.853 mln
-6.77%
jan 1, 1989
3.127 bln
-245.692 mln
-7.29%
jan 1, 1990
3.126 bln
-985.455K
-0.03%
jan 1, 1991
3.421 bln
+295.567 mln
9.46%
jan 1, 1992
3.149 bln
-272.172 mln
-7.96%
jan 1, 1993
3.559 bln
+409.837 mln
13.01%
jan 1, 1994
3.252 bln
-306.713 mln
-8.62%
jan 1, 1995
3.369 bln
+117.126 mln
3.6%
jan 1, 1996
4.594 bln
+1.224 bln
36.34%
jan 1, 1997
4.989 bln
+395.762 mln
8.62%
jan 1, 1998
5.031 bln
+41.323 mln
0.83%
jan 1, 1999
5.221 bln
+190.258 mln
3.78%
jan 1, 2000
5.248 bln
+27.062 mln
0.52%
jan 1, 2001
4.371 bln
-877.478 mln
-16.72%
jan 1, 2002
4.555 bln
+184.867 mln
4.23%
jan 1, 2003
5.86 bln
+1.305 bln
28.64%
jan 1, 2004
6.412 bln
+552.015 mln
9.42%
jan 1, 2005
7.682 bln
+1.27 bln
19.81%
jan 1, 2006
8.525 bln
+843.008 mln
10.97%
jan 1, 2007
9.322 bln
+796.796 mln
9.35%
jan 1, 2008
9.607 bln
+285.586 mln
3.06%
jan 1, 2009
11.414 bln
+1.806 bln
18.8%
jan 1, 2010
12.346 bln
+932.358 mln
8.17%
jan 1, 2011
12.6 bln
+253.498 mln
2.05%
jan 1, 2012
13.66 bln
+1.061 bln
8.42%
jan 1, 2013
13.108 bln
-552.156 mln
-4.04%
jan 1, 2014
12.984 bln
-123.874 mln
-0.95%
jan 1, 2015
14.142 bln
+1.157 bln
8.91%
jan 1, 2016
12.543 bln
-1.599 bln
-11.31%
Ranking of countries by current statistics by years


Comments: