29
/
en
AIzaSyAYiBZKx7MnpbEhh9jyipgxe19OcubqV5w
April 1, 2024
192962
Mauritania
MRT
true
2
1
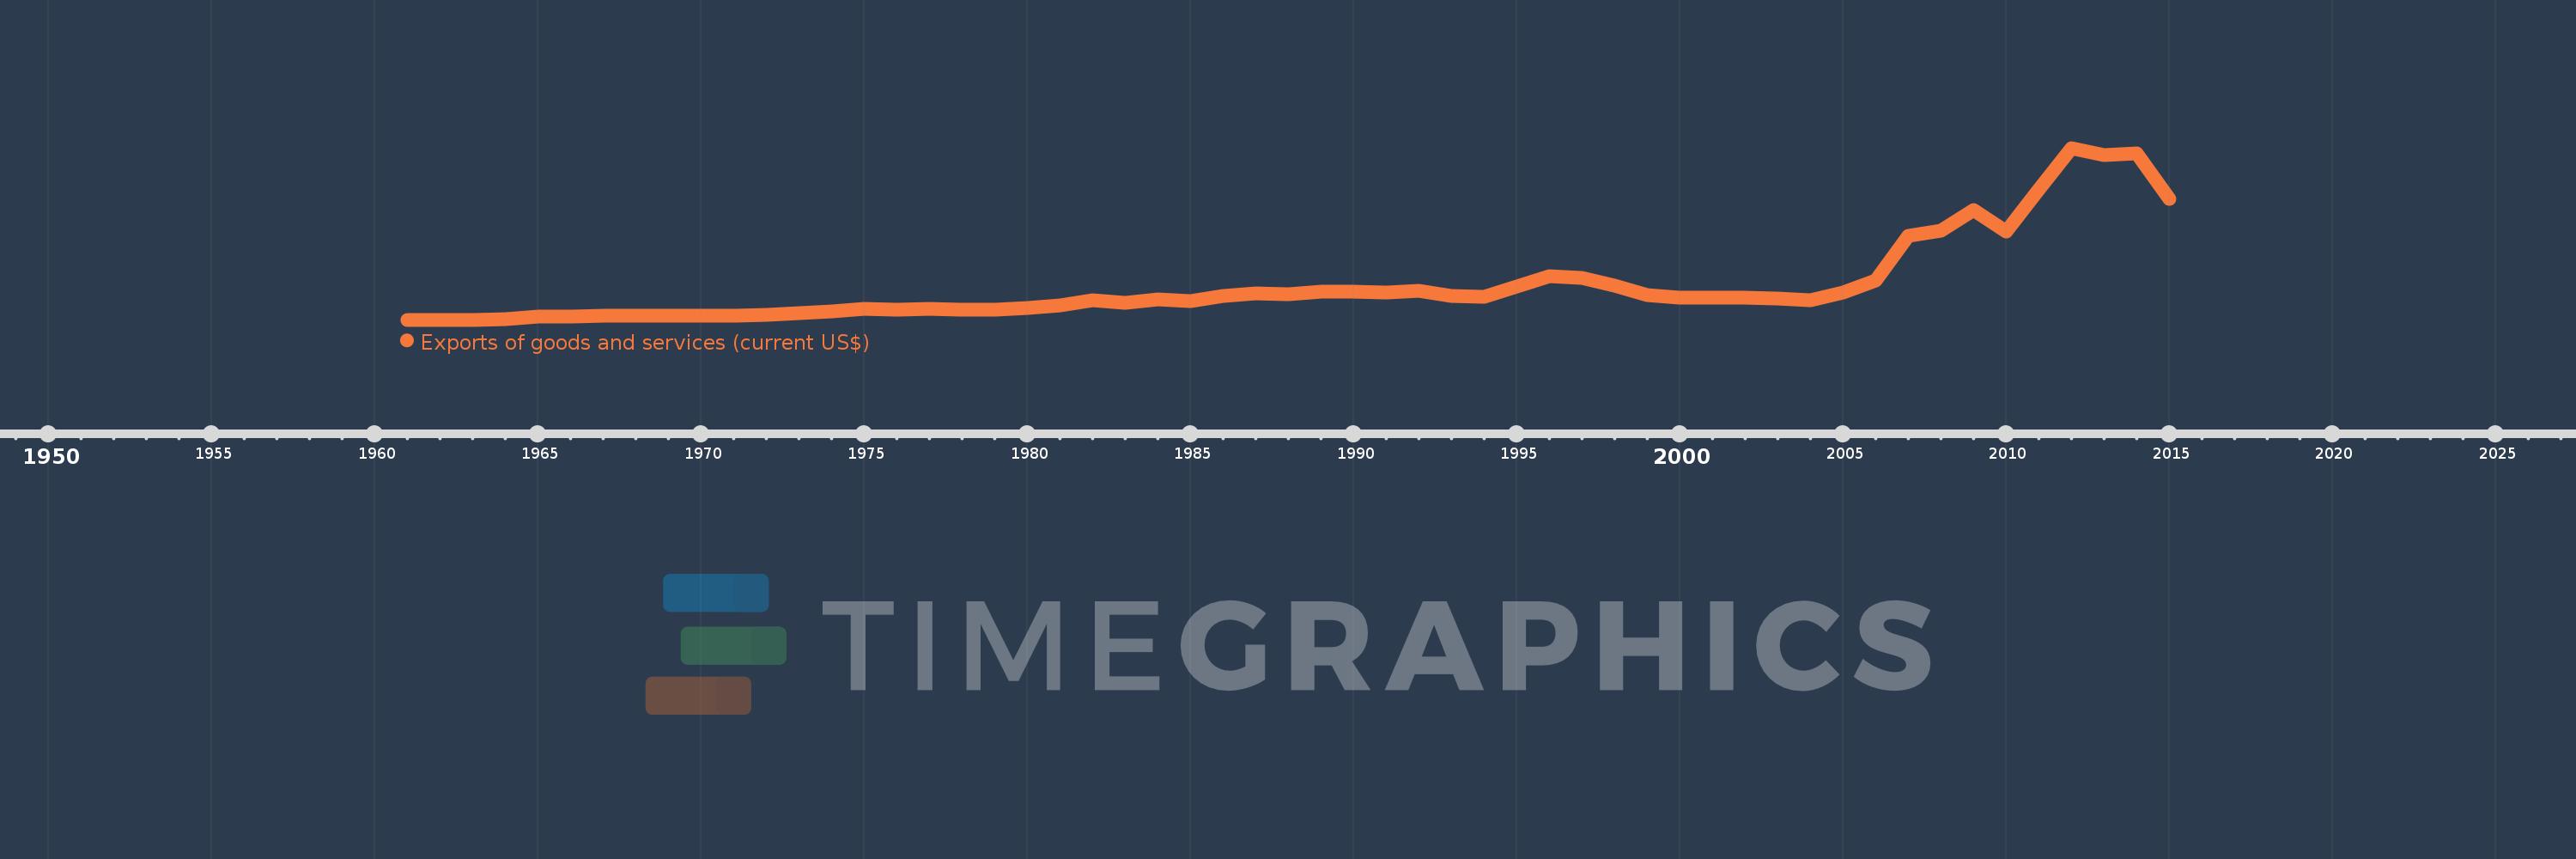
Exports of goods and services (current US$)
2015,2014,2013,2012,2011,2010,2009,2008,2007,2006,2005,2004,2003,2002,2001,2000,1999,1998,1997,1996,1995,1994,1993,1992,1991,1990,1989,1988,1987,1986,1985,1984,1983,1982,1981,1980,1979,1978,1977,1976,1975,1974,1973,1972,1971,1970,1969,1968,1967,1966,1965,1964,1963,1962,1961
This statistics in other country:
AfghanistanAlbaniaAlgeriaAngolaAntigua and BarbudaArab WorldArgentinaArmeniaArubaAustraliaAustriaAzerbaijanBahamas, TheBahrainBangladeshBarbadosBelarusBelgiumBelizeBeninBermudaBhutanBoliviaBosnia and HerzegovinaBotswanaBrazilBrunei DarussalamBulgariaBurkina FasoBurundiCabo VerdeCambodiaCameroonCanadaCaribbean small statesCentral African RepublicCentral Europe and the BalticsChadChileChinaColombiaComorosCongo, Dem. Rep.Congo, Rep.Costa RicaCote d'IvoireCroatiaCubaCyprusCzech RepublicDenmarkDjiboutiDominicaDominican RepublicEarly-demographic dividendEast Asia & PacificEast Asia & Pacific (excluding high income)East Asia & Pacific (IDA & IBRD countries)EcuadorEgypt, Arab Rep.El SalvadorEquatorial GuineaEritreaEstoniaEthiopiaEuro areaEurope & Central AsiaEurope & Central Asia (excluding high income)Europe & Central Asia (IDA & IBRD countries)European UnionFaroe IslandsFijiFinlandFragile and conflict affected situationsFranceFrench PolynesiaGabonGambia, TheGeorgiaGermanyGhanaGreeceGrenadaGuatemalaGuineaGuinea-BissauGuyanaHaitiHeavily indebted poor countries (HIPC)High incomeHondurasHong Kong SAR, ChinaHungaryIBRD onlyIcelandIDA & IBRD totalIDA blendIDA onlyIDA totalIndiaIndonesiaIran, Islamic Rep.IraqIrelandIsraelItalyJamaicaJapanJordanKazakhstanKenyaKiribatiKorea, Rep.KosovoKuwaitKyrgyz RepublicLao PDRLate-demographic dividendLatin America & Caribbean Latin America & Caribbean (excluding high income)Latin America & the Caribbean (IDA & IBRD countries)LatviaLeast developed countries: UN classificationLebanonLesothoLiberiaLibyaLithuaniaLow & middle incomeLow incomeLower middle incomeLuxembourgMacao SAR, ChinaMacedonia, FYRMadagascarMalawiMalaysiaMaldivesMaliMaltaMauritaniaMauritiusMexicoMicronesia, Fed. Sts.Middle East & North AfricaMiddle East & North Africa (excluding high income)Middle East & North Africa (IDA & IBRD countries)Middle incomeMoldovaMongoliaMontenegroMoroccoMozambiqueMyanmarNamibiaNepalNetherlandsNew CaledoniaNew ZealandNicaraguaNigerNigeriaNorth AmericaNorwayOECD membersOmanOther small statesPacific island small statesPakistanPalauPanamaPapua New GuineaParaguayPeruPhilippinesPolandPortugalPost-demographic dividendPre-demographic dividendPuerto RicoQatarRomaniaRussian FederationRwandaSamoaSaudi ArabiaSenegalSerbiaSeychellesSierra LeoneSingaporeSlovak RepublicSloveniaSmall statesSolomon IslandsSomaliaSouth AfricaSouth AsiaSouth Asia (IDA & IBRD)South SudanSpainSri LankaSt. Kitts and NevisSt. LuciaSt. Vincent and the GrenadinesSub-Saharan Africa Sub-Saharan Africa (excluding high income)Sub-Saharan Africa (IDA & IBRD countries)SudanSurinameSwazilandSwedenSwitzerlandSyrian Arab RepublicTajikistanTanzaniaThailandTimor-LesteTogoTongaTrinidad and TobagoTunisiaTurkeyTurkmenistanUgandaUkraineUnited Arab EmiratesUnited KingdomUnited StatesUpper middle incomeUruguayUzbekistanVanuatuVenezuela, RBVietnamWest Bank and GazaWorldYemen, Rep.ZambiaZimbabwe Timeline:
This timeline shows a graph from 1961 to 2015 of Mauritania. No data until 1960. Number of actual observations by date: 55.
Source name:
World Development Indicators
Source organization:
World Bank national accounts data, and OECD National Accounts data files.
Categories, topics:
Economy & Growth, Trade
Last updated:
apr 23, 2017
Indicators value changes by year
Minimum:
14.136 mln
jan 1, 1961
Maximum:
2.9 bln
jan 1, 2012
At the date of observation
Value
Absolute change
Change from previous value
jan 1, 1961
14.136 mln
+14.136 mln
0.0%
jan 1, 1962
15.448 mln
+1.313 mln
9.29%
jan 1, 1963
16.155 mln
+706.777K
4.58%
jan 1, 1964
28.675 mln
+12.52 mln
77.5%
jan 1, 1965
66.134 mln
+37.459 mln
130.63%
jan 1, 1966
72.899 mln
+6.765 mln
10.23%
jan 1, 1967
77.543 mln
+4.644 mln
6.37%
jan 1, 1968
79.562 mln
+2.019 mln
2.6%
jan 1, 1969
80.069 mln
+506.329K
0.64%
jan 1, 1970
77.542 mln
-2.526 mln
-3.16%
jan 1, 1971
85.44 mln
+7.898 mln
10.18%
jan 1, 1972
91.321 mln
+5.881 mln
6.88%
jan 1, 1973
127.8 mln
+36.48 mln
39.95%
jan 1, 1974
156.298 mln
+28.497 mln
22.3%
jan 1, 1975
200.318 mln
+44.02 mln
28.16%
jan 1, 1976
182.944 mln
-17.374 mln
-8.67%
jan 1, 1977
198.986 mln
+16.042 mln
8.77%
jan 1, 1978
177.221 mln
-21.765 mln
-10.94%
jan 1, 1979
181.657 mln
+4.436 mln
2.5%
jan 1, 1980
213.738 mln
+32.082 mln
17.66%
jan 1, 1981
261.091 mln
+47.353 mln
22.15%
jan 1, 1982
337.095 mln
+76.003 mln
29.11%
jan 1, 1983
300.569 mln
-36.525 mln
-10.84%
jan 1, 1984
360.579 mln
+60.01 mln
19.97%
jan 1, 1985
331.391 mln
-29.188 mln
-8.09%
jan 1, 1986
409.294 mln
+77.903 mln
23.51%
jan 1, 1987
450.849 mln
+41.555 mln
10.15%
jan 1, 1988
446.625 mln
-4.225 mln
-0.94%
jan 1, 1989
481.259 mln
+34.634 mln
7.75%
jan 1, 1990
489.12 mln
+7.861 mln
1.63%
jan 1, 1991
465.365 mln
-23.754 mln
-4.86%
jan 1, 1992
501.583 mln
+36.218 mln
7.78%
jan 1, 1993
413.292 mln
-88.291 mln
-17.6%
jan 1, 1994
399.9 mln
-13.392 mln
-3.24%
jan 1, 1995
576.042 mln
+176.142 mln
44.05%
jan 1, 1996
740.712 mln
+164.67 mln
28.59%
jan 1, 1997
712.724 mln
-27.988 mln
-3.78%
jan 1, 1998
590.569 mln
-122.156 mln
-17.14%
jan 1, 1999
424.303 mln
-166.265 mln
-28.15%
jan 1, 2000
382.886 mln
-41.417 mln
-9.76%
jan 1, 2001
387.597 mln
+4.711 mln
1.23%
jan 1, 2002
380.856 mln
-6.741 mln
-1.74%
jan 1, 2003
375.32 mln
-5.537 mln
-1.45%
jan 1, 2004
335.274 mln
-40.046 mln
-10.67%
jan 1, 2005
470.268 mln
+134.994 mln
40.26%
jan 1, 2006
671.152 mln
+200.885 mln
42.72%
jan 1, 2007
1.42 bln
+748.848 mln
111.58%
jan 1, 2008
1.506 bln
+86.276 mln
6.08%
jan 1, 2009
1.852 bln
+345.906 mln
22.96%
jan 1, 2010
1.499 bln
-352.761 mln
-19.05%
jan 1, 2011
2.201 bln
+701.778 mln
46.8%
jan 1, 2012
2.9 bln
+698.818 mln
31.75%
jan 1, 2013
2.774 bln
-126.199 mln
-4.35%
jan 1, 2014
2.813 bln
+39.25 mln
1.42%
jan 1, 2015
2.051 bln
-762.246 mln
-27.1%
Ranking of countries by current statistics by years


Comments: