29
/
en
AIzaSyAYiBZKx7MnpbEhh9jyipgxe19OcubqV5w
April 1, 2024
201501
Morocco
MAR
true
2
1
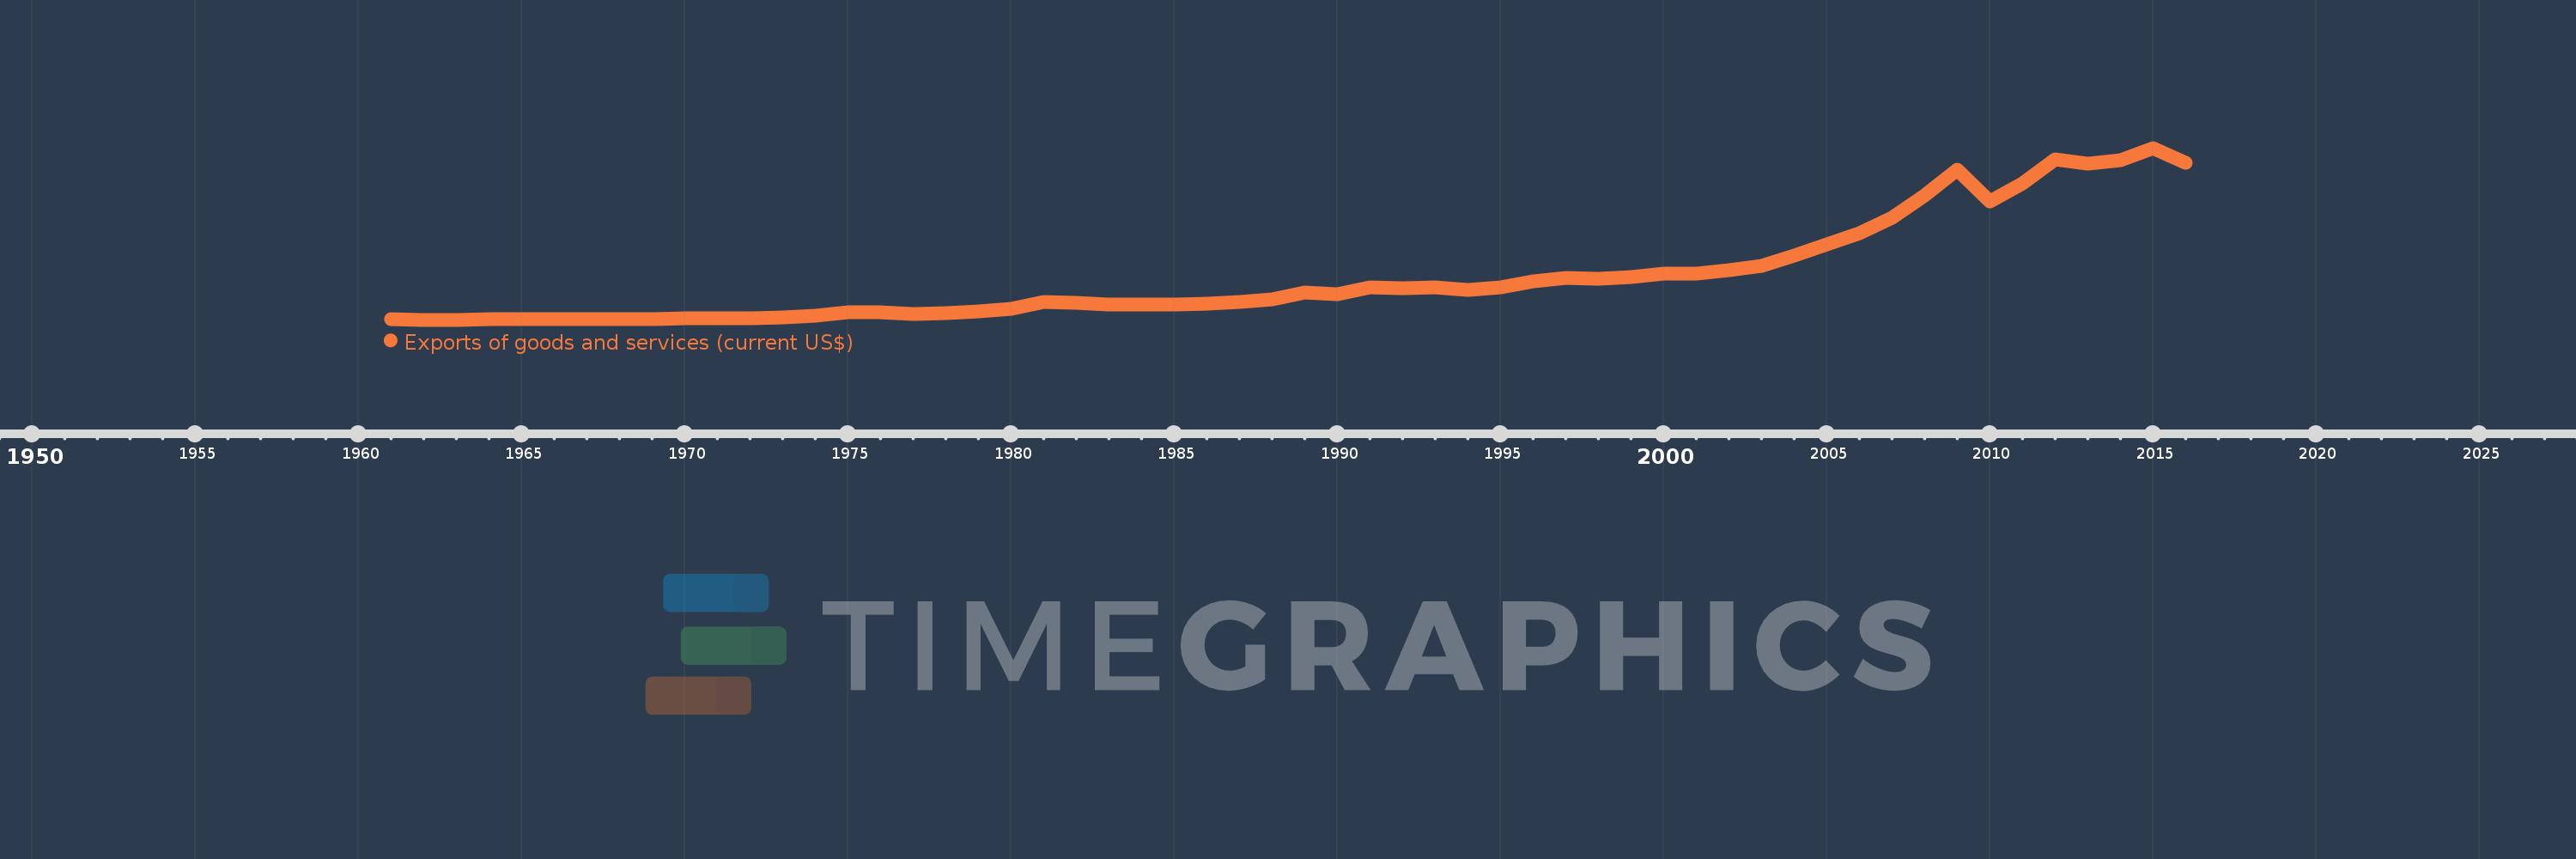
Exports of goods and services (current US$)
2016,2015,2014,2013,2012,2011,2010,2009,2008,2007,2006,2005,2004,2003,2002,2001,2000,1999,1998,1997,1996,1995,1994,1993,1992,1991,1990,1989,1988,1987,1986,1985,1984,1983,1982,1981,1980,1979,1978,1977,1976,1975,1974,1973,1972,1971,1970,1969,1968,1967,1966,1965,1964,1963,1962,1961
This statistics in other country:
AfghanistanAlbaniaAlgeriaAngolaAntigua and BarbudaArab WorldArgentinaArmeniaArubaAustraliaAustriaAzerbaijanBahamas, TheBahrainBangladeshBarbadosBelarusBelgiumBelizeBeninBermudaBhutanBoliviaBosnia and HerzegovinaBotswanaBrazilBrunei DarussalamBulgariaBurkina FasoBurundiCabo VerdeCambodiaCameroonCanadaCaribbean small statesCentral African RepublicCentral Europe and the BalticsChadChileChinaColombiaComorosCongo, Dem. Rep.Congo, Rep.Costa RicaCote d'IvoireCroatiaCubaCyprusCzech RepublicDenmarkDjiboutiDominicaDominican RepublicEarly-demographic dividendEast Asia & PacificEast Asia & Pacific (excluding high income)East Asia & Pacific (IDA & IBRD countries)EcuadorEgypt, Arab Rep.El SalvadorEquatorial GuineaEritreaEstoniaEthiopiaEuro areaEurope & Central AsiaEurope & Central Asia (excluding high income)Europe & Central Asia (IDA & IBRD countries)European UnionFaroe IslandsFijiFinlandFragile and conflict affected situationsFranceFrench PolynesiaGabonGambia, TheGeorgiaGermanyGhanaGreeceGrenadaGuatemalaGuineaGuinea-BissauGuyanaHaitiHeavily indebted poor countries (HIPC)High incomeHondurasHong Kong SAR, ChinaHungaryIBRD onlyIcelandIDA & IBRD totalIDA blendIDA onlyIDA totalIndiaIndonesiaIran, Islamic Rep.IraqIrelandIsraelItalyJamaicaJapanJordanKazakhstanKenyaKiribatiKorea, Rep.KosovoKuwaitKyrgyz RepublicLao PDRLate-demographic dividendLatin America & Caribbean Latin America & Caribbean (excluding high income)Latin America & the Caribbean (IDA & IBRD countries)LatviaLeast developed countries: UN classificationLebanonLesothoLiberiaLibyaLithuaniaLow & middle incomeLow incomeLower middle incomeLuxembourgMacao SAR, ChinaMacedonia, FYRMadagascarMalawiMalaysiaMaldivesMaliMaltaMauritaniaMauritiusMexicoMicronesia, Fed. Sts.Middle East & North AfricaMiddle East & North Africa (excluding high income)Middle East & North Africa (IDA & IBRD countries)Middle incomeMoldovaMongoliaMontenegroMoroccoMozambiqueMyanmarNamibiaNepalNetherlandsNew CaledoniaNew ZealandNicaraguaNigerNigeriaNorth AmericaNorwayOECD membersOmanOther small statesPacific island small statesPakistanPalauPanamaPapua New GuineaParaguayPeruPhilippinesPolandPortugalPost-demographic dividendPre-demographic dividendPuerto RicoQatarRomaniaRussian FederationRwandaSamoaSaudi ArabiaSenegalSerbiaSeychellesSierra LeoneSingaporeSlovak RepublicSloveniaSmall statesSolomon IslandsSomaliaSouth AfricaSouth AsiaSouth Asia (IDA & IBRD)South SudanSpainSri LankaSt. Kitts and NevisSt. LuciaSt. Vincent and the GrenadinesSub-Saharan Africa Sub-Saharan Africa (excluding high income)Sub-Saharan Africa (IDA & IBRD countries)SudanSurinameSwazilandSwedenSwitzerlandSyrian Arab RepublicTajikistanTanzaniaThailandTimor-LesteTogoTongaTrinidad and TobagoTunisiaTurkeyTurkmenistanUgandaUkraineUnited Arab EmiratesUnited KingdomUnited StatesUpper middle incomeUruguayUzbekistanVanuatuVenezuela, RBVietnamWest Bank and GazaWorldYemen, Rep.ZambiaZimbabwe Timeline:
This timeline shows a graph from 1961 to 2016 of Morocco. No data until 1960. Number of actual observations by date: 56.
Source name:
World Development Indicators
Source organization:
World Bank national accounts data, and OECD National Accounts data files.
Categories, topics:
Economy & Growth, Trade
Last updated:
apr 23, 2017
Indicators value changes by year
Minimum:
428.811 mln
jan 1, 1963
Maximum:
37.725 bln
jan 1, 2015
At the date of observation
Value
Absolute change
Change from previous value
jan 1, 1961
480.19 mln
+480.19 mln
0.0%
jan 1, 1962
440.668 mln
-39.522 mln
-8.23%
jan 1, 1963
428.811 mln
-11.857 mln
-2.69%
jan 1, 1964
476.238 mln
+47.426 mln
11.06%
jan 1, 1965
545.401 mln
+69.163 mln
14.52%
jan 1, 1966
535.52 mln
-9.88 mln
-1.81%
jan 1, 1967
545.401 mln
+9.88 mln
1.85%
jan 1, 1968
545.401 mln
0.0
0.0%
jan 1, 1969
604.683 mln
+59.283 mln
10.87%
jan 1, 1970
671.08 mln
+66.397 mln
10.98%
jan 1, 1971
697.777 mln
+26.697 mln
3.98%
jan 1, 1972
738.594 mln
+40.817 mln
5.85%
jan 1, 1973
942.467 mln
+203.872 mln
27.6%
jan 1, 1974
1.301 bln
+358.198 mln
38.01%
jan 1, 1975
2.115 bln
+814.421 mln
62.62%
jan 1, 1976
2.019 bln
-95.937 mln
-4.54%
jan 1, 1977
1.717 bln
-302.112 mln
-14.96%
jan 1, 1978
1.867 bln
+149.95 mln
8.73%
jan 1, 1979
2.167 bln
+300.004 mln
16.07%
jan 1, 1980
2.707 bln
+539.685 mln
24.9%
jan 1, 1981
4.201 bln
+1.495 bln
55.23%
jan 1, 1982
4.033 bln
-168.667 mln
-4.01%
jan 1, 1983
3.822 bln
-210.41 mln
-5.22%
jan 1, 1984
3.698 bln
-124.413 mln
-3.25%
jan 1, 1985
3.8 bln
+102.227 mln
2.76%
jan 1, 1986
3.825 bln
+24.563 mln
0.65%
jan 1, 1987
4.259 bln
+434.025 mln
11.35%
jan 1, 1988
4.893 bln
+634.319 mln
14.89%
jan 1, 1989
6.425 bln
+1.532 bln
31.32%
jan 1, 1990
5.935 bln
-490.281 mln
-7.63%
jan 1, 1991
7.412 bln
+1.477 bln
24.88%
jan 1, 1992
7.206 bln
-206.329 mln
-2.78%
jan 1, 1993
7.474 bln
+268.77 mln
3.73%
jan 1, 1994
6.983 bln
-491.035 mln
-6.57%
jan 1, 1995
7.455 bln
+471.538 mln
6.75%
jan 1, 1996
8.849 bln
+1.394 bln
18.7%
jan 1, 1997
9.425 bln
+575.301 mln
6.5%
jan 1, 1998
9.366 bln
-58.948 mln
-0.63%
jan 1, 1999
9.784 bln
+418.47 mln
4.47%
jan 1, 2000
10.472 bln
+688.032 mln
7.03%
jan 1, 2001
10.409 bln
-63.422 mln
-0.61%
jan 1, 2002
11.131 bln
+722.366 mln
6.94%
jan 1, 2003
12.214 bln
+1.083 bln
9.73%
jan 1, 2004
14.32 bln
+2.106 bln
17.24%
jan 1, 2005
16.759 bln
+2.44 bln
17.04%
jan 1, 2006
19.276 bln
+2.517 bln
15.02%
jan 1, 2007
22.484 bln
+3.208 bln
16.64%
jan 1, 2008
27.326 bln
+4.842 bln
21.54%
jan 1, 2009
33.064 bln
+5.738 bln
21.0%
jan 1, 2010
26.014 bln
-7.05 bln
-21.32%
jan 1, 2011
30.047 bln
+4.032 bln
15.5%
jan 1, 2012
35.176 bln
+5.129 bln
17.07%
jan 1, 2013
34.324 bln
-851.613 mln
-2.42%
jan 1, 2014
35.015 bln
+690.954 mln
2.01%
jan 1, 2015
37.725 bln
+2.71 bln
7.74%
jan 1, 2016
34.498 bln
-3.227 bln
-8.56%
Ranking of countries by current statistics by years


Comments: