29
/
en
AIzaSyAYiBZKx7MnpbEhh9jyipgxe19OcubqV5w
April 1, 2024
24847
Caribbean small states
CSS
false
2
1
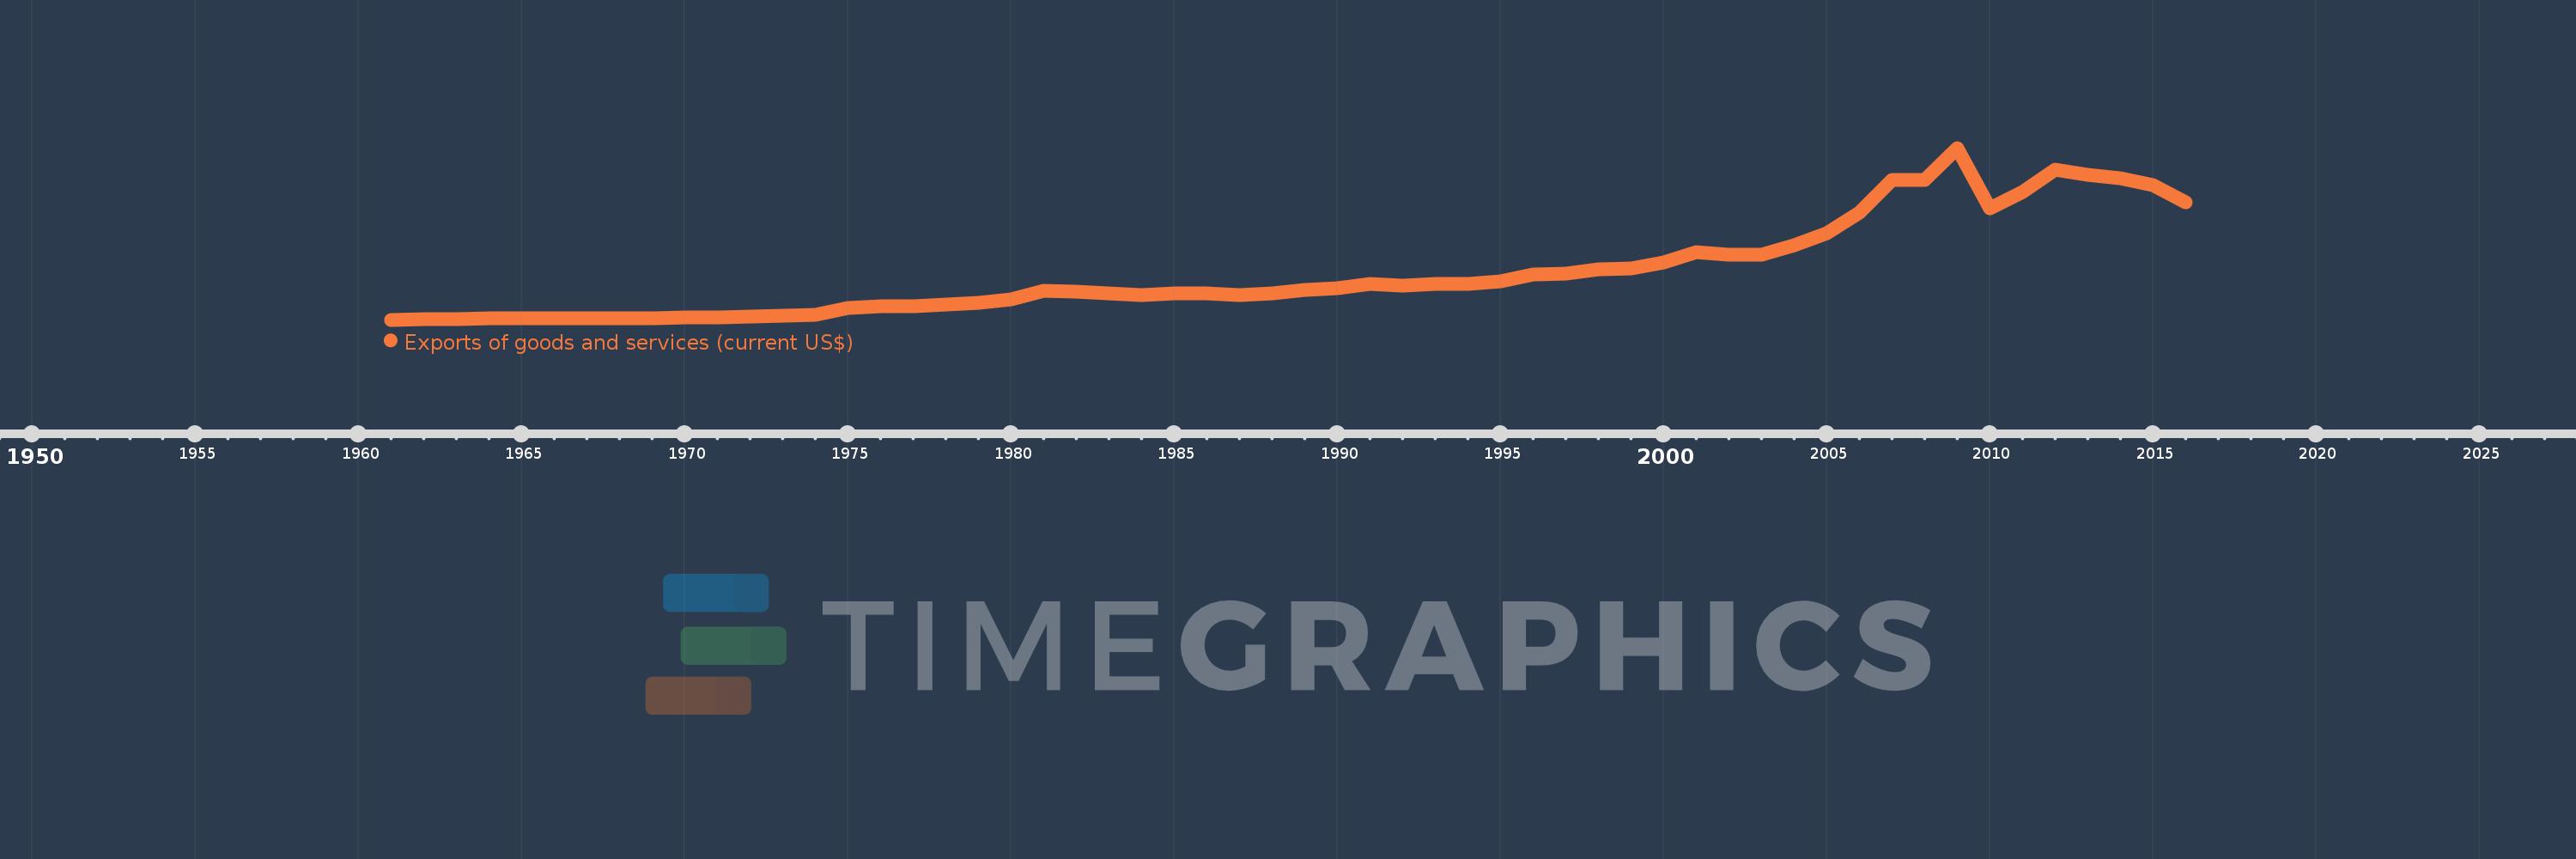
Exports of goods and services (current US$)
2016,2015,2014,2013,2012,2011,2010,2009,2008,2007,2006,2005,2004,2003,2002,2001,2000,1999,1998,1997,1996,1995,1994,1993,1992,1991,1990,1989,1988,1987,1986,1985,1984,1983,1982,1981,1980,1979,1978,1977,1976,1975,1974,1973,1972,1971,1970,1969,1968,1967,1966,1965,1964,1963,1962,1961
This statistics in other country:
AfghanistanAlbaniaAlgeriaAngolaAntigua and BarbudaArab WorldArgentinaArmeniaArubaAustraliaAustriaAzerbaijanBahamas, TheBahrainBangladeshBarbadosBelarusBelgiumBelizeBeninBermudaBhutanBoliviaBosnia and HerzegovinaBotswanaBrazilBrunei DarussalamBulgariaBurkina FasoBurundiCabo VerdeCambodiaCameroonCanadaCaribbean small statesCentral African RepublicCentral Europe and the BalticsChadChileChinaColombiaComorosCongo, Dem. Rep.Congo, Rep.Costa RicaCote d'IvoireCroatiaCubaCyprusCzech RepublicDenmarkDjiboutiDominicaDominican RepublicEarly-demographic dividendEast Asia & PacificEast Asia & Pacific (excluding high income)East Asia & Pacific (IDA & IBRD countries)EcuadorEgypt, Arab Rep.El SalvadorEquatorial GuineaEritreaEstoniaEthiopiaEuro areaEurope & Central AsiaEurope & Central Asia (excluding high income)Europe & Central Asia (IDA & IBRD countries)European UnionFaroe IslandsFijiFinlandFragile and conflict affected situationsFranceFrench PolynesiaGabonGambia, TheGeorgiaGermanyGhanaGreeceGrenadaGuatemalaGuineaGuinea-BissauGuyanaHaitiHeavily indebted poor countries (HIPC)High incomeHondurasHong Kong SAR, ChinaHungaryIBRD onlyIcelandIDA & IBRD totalIDA blendIDA onlyIDA totalIndiaIndonesiaIran, Islamic Rep.IraqIrelandIsraelItalyJamaicaJapanJordanKazakhstanKenyaKiribatiKorea, Rep.KosovoKuwaitKyrgyz RepublicLao PDRLate-demographic dividendLatin America & Caribbean Latin America & Caribbean (excluding high income)Latin America & the Caribbean (IDA & IBRD countries)LatviaLeast developed countries: UN classificationLebanonLesothoLiberiaLibyaLithuaniaLow & middle incomeLow incomeLower middle incomeLuxembourgMacao SAR, ChinaMacedonia, FYRMadagascarMalawiMalaysiaMaldivesMaliMaltaMauritaniaMauritiusMexicoMicronesia, Fed. Sts.Middle East & North AfricaMiddle East & North Africa (excluding high income)Middle East & North Africa (IDA & IBRD countries)Middle incomeMoldovaMongoliaMontenegroMoroccoMozambiqueMyanmarNamibiaNepalNetherlandsNew CaledoniaNew ZealandNicaraguaNigerNigeriaNorth AmericaNorwayOECD membersOmanOther small statesPacific island small statesPakistanPalauPanamaPapua New GuineaParaguayPeruPhilippinesPolandPortugalPost-demographic dividendPre-demographic dividendPuerto RicoQatarRomaniaRussian FederationRwandaSamoaSaudi ArabiaSenegalSerbiaSeychellesSierra LeoneSingaporeSlovak RepublicSloveniaSmall statesSolomon IslandsSomaliaSouth AfricaSouth AsiaSouth Asia (IDA & IBRD)South SudanSpainSri LankaSt. Kitts and NevisSt. LuciaSt. Vincent and the GrenadinesSub-Saharan Africa Sub-Saharan Africa (excluding high income)Sub-Saharan Africa (IDA & IBRD countries)SudanSurinameSwazilandSwedenSwitzerlandSyrian Arab RepublicTajikistanTanzaniaThailandTimor-LesteTogoTongaTrinidad and TobagoTunisiaTurkeyTurkmenistanUgandaUkraineUnited Arab EmiratesUnited KingdomUnited StatesUpper middle incomeUruguayUzbekistanVanuatuVenezuela, RBVietnamWest Bank and GazaWorldYemen, Rep.ZambiaZimbabwe Timeline:
This timeline shows a graph from 1961 to 2016 of Caribbean small states. No data until 1960. Number of actual observations by date: 56.
Source name:
World Development Indicators
Source organization:
World Bank national accounts data, and OECD National Accounts data files.
Categories, topics:
Economy & Growth, Trade
Last updated:
apr 23, 2017
Indicators value changes by year
Minimum:
872.582 mln
jan 1, 1961
Maximum:
37.083 bln
jan 1, 2009
At the date of observation
Value
Absolute change
Change from previous value
jan 1, 1961
872.582 mln
+872.582 mln
0.0%
jan 1, 1962
1.017 bln
+144.128 mln
16.52%
jan 1, 1963
1.045 bln
+28.486 mln
2.8%
jan 1, 1964
1.119 bln
+73.325 mln
7.02%
jan 1, 1965
1.196 bln
+77.133 mln
6.9%
jan 1, 1966
1.249 bln
+53.47 mln
4.47%
jan 1, 1967
1.19 bln
-59.115 mln
-4.73%
jan 1, 1968
1.257 bln
+66.689 mln
5.6%
jan 1, 1969
1.248 bln
-8.869 mln
-0.71%
jan 1, 1970
1.354 bln
+106.63 mln
8.55%
jan 1, 1971
1.417 bln
+62.947 mln
4.65%
jan 1, 1972
1.573 bln
+155.198 mln
10.95%
jan 1, 1973
1.752 bln
+179.812 mln
11.43%
jan 1, 1974
1.93 bln
+177.467 mln
10.13%
jan 1, 1975
3.267 bln
+1.337 bln
69.28%
jan 1, 1976
3.761 bln
+493.601 mln
15.11%
jan 1, 1977
3.633 bln
-127.402 mln
-3.39%
jan 1, 1978
4.005 bln
+371.966 mln
10.24%
jan 1, 1979
4.365 bln
+359.979 mln
8.99%
jan 1, 1980
5.215 bln
+849.526 mln
19.46%
jan 1, 1981
6.933 bln
+1.718 bln
32.95%
jan 1, 1982
6.866 bln
-66.797 mln
-0.96%
jan 1, 1983
6.351 bln
-514.819 mln
-7.5%
jan 1, 1984
6.104 bln
-247.432 mln
-3.9%
jan 1, 1985
6.482 bln
+378.102 mln
6.19%
jan 1, 1986
6.503 bln
+20.84 mln
0.32%
jan 1, 1987
6.142 bln
-361.353 mln
-5.56%
jan 1, 1988
6.448 bln
+306.27 mln
4.99%
jan 1, 1989
7.105 bln
+657.169 mln
10.19%
jan 1, 1990
7.537 bln
+432.19 mln
6.08%
jan 1, 1991
8.422 bln
+884.668 mln
11.74%
jan 1, 1992
8.118 bln
-304.113 mln
-3.61%
jan 1, 1993
8.473 bln
+355.088 mln
4.37%
jan 1, 1994
8.471 bln
-2.184 mln
-0.03%
jan 1, 1995
9.022 bln
+550.954 mln
6.5%
jan 1, 1996
10.448 bln
+1.427 bln
15.81%
jan 1, 1997
10.677 bln
+228.762 mln
2.19%
jan 1, 1998
11.469 bln
+792.475 mln
7.42%
jan 1, 1999
11.618 bln
+148.326 mln
1.29%
jan 1, 2000
12.874 bln
+1.257 bln
10.82%
jan 1, 2001
15.113 bln
+2.239 bln
17.39%
jan 1, 2002
14.633 bln
-480.64 mln
-3.18%
jan 1, 2003
14.616 bln
-16.455 mln
-0.11%
jan 1, 2004
16.547 bln
+1.93 bln
13.21%
jan 1, 2005
19.05 bln
+2.504 bln
15.13%
jan 1, 2006
23.361 bln
+4.311 bln
22.63%
jan 1, 2007
30.28 bln
+6.919 bln
29.62%
jan 1, 2008
30.322 bln
+41.649 mln
0.14%
jan 1, 2009
37.083 bln
+6.762 bln
22.3%
jan 1, 2010
24.426 bln
-12.657 bln
-34.13%
jan 1, 2011
27.713 bln
+3.287 bln
13.46%
jan 1, 2012
32.415 bln
+4.701 bln
16.96%
jan 1, 2013
31.428 bln
-986.035 mln
-3.04%
jan 1, 2014
30.731 bln
-697.568 mln
-2.22%
jan 1, 2015
29.263 bln
-1.468 bln
-4.78%
jan 1, 2016
25.684 bln
-3.579 bln
-12.23%
Ranking of countries by current statistics by years


Comments: