29
/
en
AIzaSyAYiBZKx7MnpbEhh9jyipgxe19OcubqV5w
April 1, 2024
159355
Ireland
IRL
true
2
1
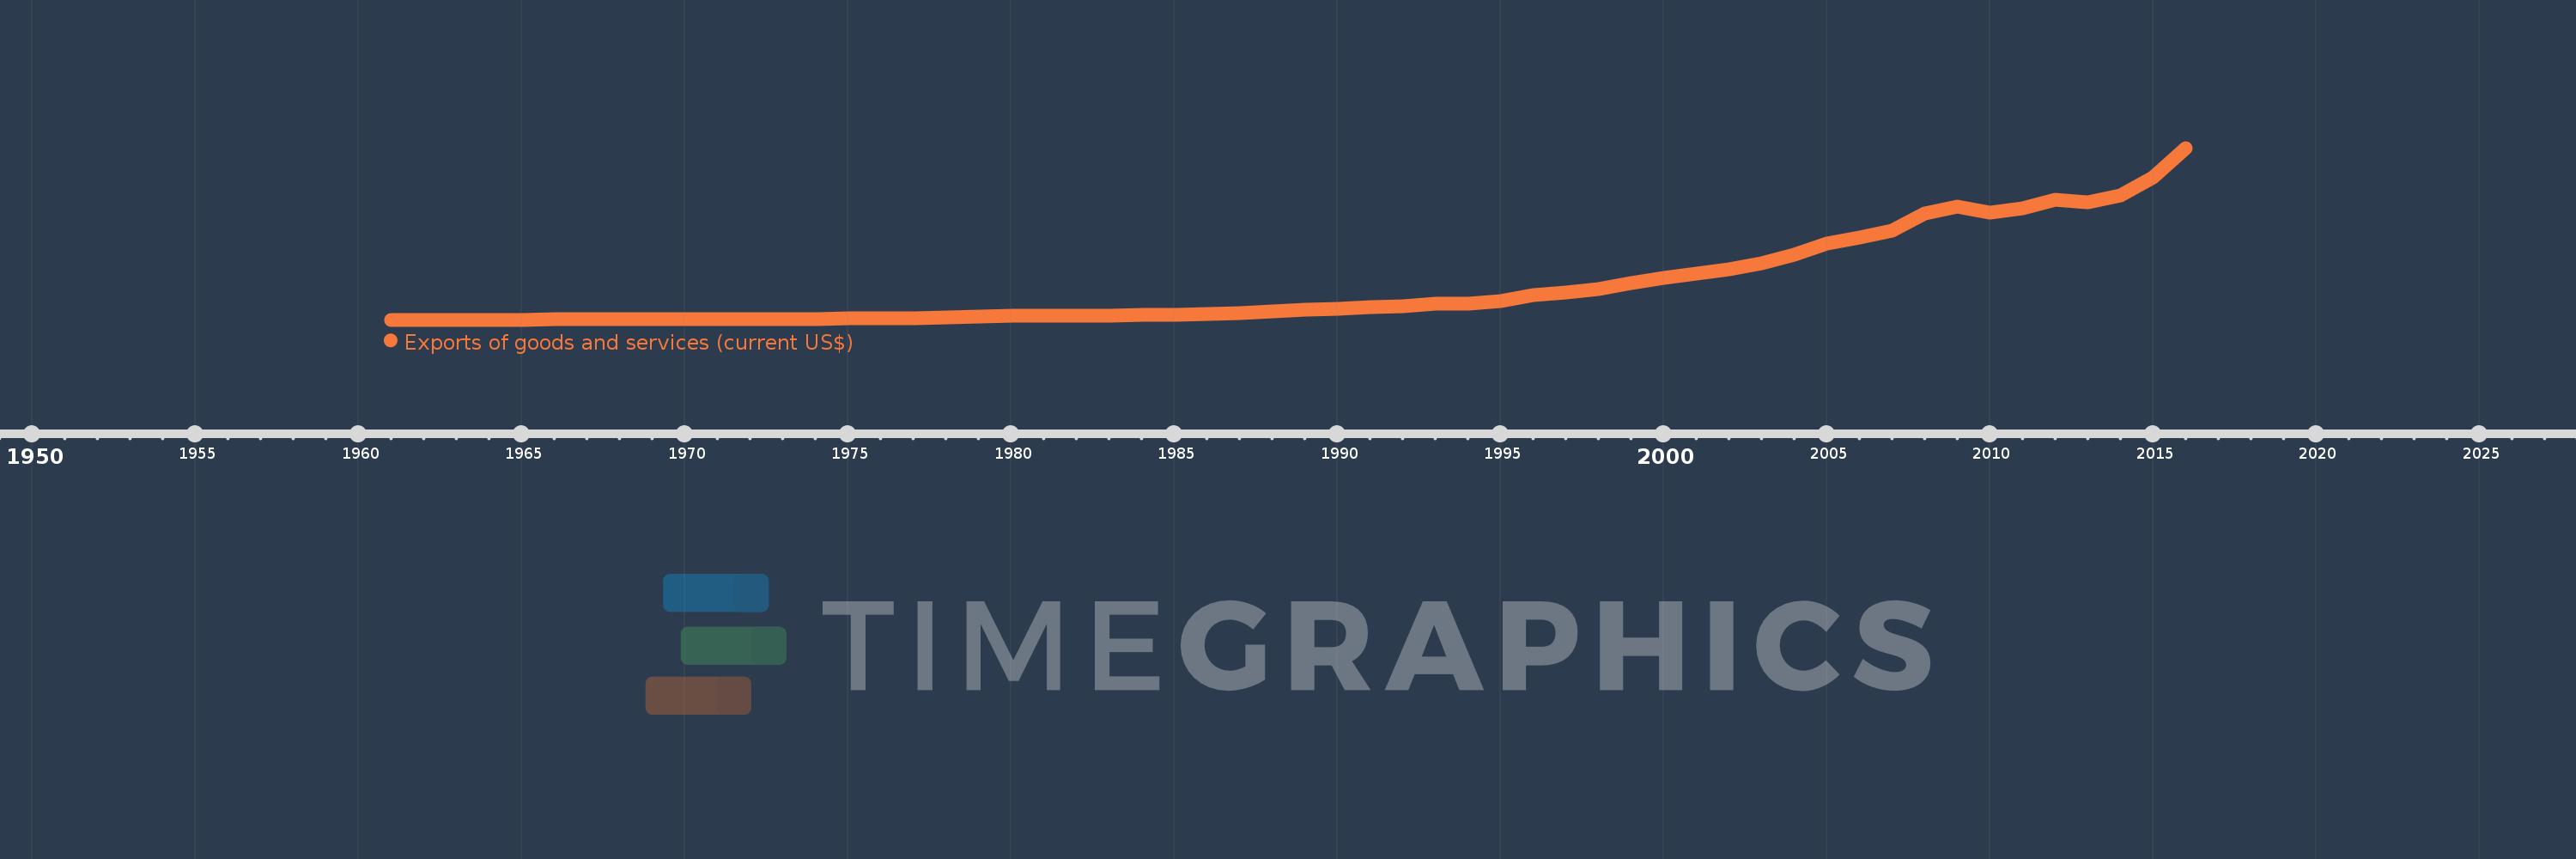
Exports of goods and services (current US$)
2016,2015,2014,2013,2012,2011,2010,2009,2008,2007,2006,2005,2004,2003,2002,2001,2000,1999,1998,1997,1996,1995,1994,1993,1992,1991,1990,1989,1988,1987,1986,1985,1984,1983,1982,1981,1980,1979,1978,1977,1976,1975,1974,1973,1972,1971,1970,1969,1968,1967,1966,1965,1964,1963,1962,1961
This statistics in other country:
AfghanistanAlbaniaAlgeriaAngolaAntigua and BarbudaArab WorldArgentinaArmeniaArubaAustraliaAustriaAzerbaijanBahamas, TheBahrainBangladeshBarbadosBelarusBelgiumBelizeBeninBermudaBhutanBoliviaBosnia and HerzegovinaBotswanaBrazilBrunei DarussalamBulgariaBurkina FasoBurundiCabo VerdeCambodiaCameroonCanadaCaribbean small statesCentral African RepublicCentral Europe and the BalticsChadChileChinaColombiaComorosCongo, Dem. Rep.Congo, Rep.Costa RicaCote d'IvoireCroatiaCubaCyprusCzech RepublicDenmarkDjiboutiDominicaDominican RepublicEarly-demographic dividendEast Asia & PacificEast Asia & Pacific (excluding high income)East Asia & Pacific (IDA & IBRD countries)EcuadorEgypt, Arab Rep.El SalvadorEquatorial GuineaEritreaEstoniaEthiopiaEuro areaEurope & Central AsiaEurope & Central Asia (excluding high income)Europe & Central Asia (IDA & IBRD countries)European UnionFaroe IslandsFijiFinlandFragile and conflict affected situationsFranceFrench PolynesiaGabonGambia, TheGeorgiaGermanyGhanaGreeceGrenadaGuatemalaGuineaGuinea-BissauGuyanaHaitiHeavily indebted poor countries (HIPC)High incomeHondurasHong Kong SAR, ChinaHungaryIBRD onlyIcelandIDA & IBRD totalIDA blendIDA onlyIDA totalIndiaIndonesiaIran, Islamic Rep.IraqIrelandIsraelItalyJamaicaJapanJordanKazakhstanKenyaKiribatiKorea, Rep.KosovoKuwaitKyrgyz RepublicLao PDRLate-demographic dividendLatin America & Caribbean Latin America & Caribbean (excluding high income)Latin America & the Caribbean (IDA & IBRD countries)LatviaLeast developed countries: UN classificationLebanonLesothoLiberiaLibyaLithuaniaLow & middle incomeLow incomeLower middle incomeLuxembourgMacao SAR, ChinaMacedonia, FYRMadagascarMalawiMalaysiaMaldivesMaliMaltaMauritaniaMauritiusMexicoMicronesia, Fed. Sts.Middle East & North AfricaMiddle East & North Africa (excluding high income)Middle East & North Africa (IDA & IBRD countries)Middle incomeMoldovaMongoliaMontenegroMoroccoMozambiqueMyanmarNamibiaNepalNetherlandsNew CaledoniaNew ZealandNicaraguaNigerNigeriaNorth AmericaNorwayOECD membersOmanOther small statesPacific island small statesPakistanPalauPanamaPapua New GuineaParaguayPeruPhilippinesPolandPortugalPost-demographic dividendPre-demographic dividendPuerto RicoQatarRomaniaRussian FederationRwandaSamoaSaudi ArabiaSenegalSerbiaSeychellesSierra LeoneSingaporeSlovak RepublicSloveniaSmall statesSolomon IslandsSomaliaSouth AfricaSouth AsiaSouth Asia (IDA & IBRD)South SudanSpainSri LankaSt. Kitts and NevisSt. LuciaSt. Vincent and the GrenadinesSub-Saharan Africa Sub-Saharan Africa (excluding high income)Sub-Saharan Africa (IDA & IBRD countries)SudanSurinameSwazilandSwedenSwitzerlandSyrian Arab RepublicTajikistanTanzaniaThailandTimor-LesteTogoTongaTrinidad and TobagoTunisiaTurkeyTurkmenistanUgandaUkraineUnited Arab EmiratesUnited KingdomUnited StatesUpper middle incomeUruguayUzbekistanVanuatuVenezuela, RBVietnamWest Bank and GazaWorldYemen, Rep.ZambiaZimbabwe Timeline:
This timeline shows a graph from 1961 to 2016 of Ireland. No data until 1960. Number of actual observations by date: 56.
Source name:
World Development Indicators
Source organization:
World Bank national accounts data, and OECD National Accounts data files.
Categories, topics:
Economy & Growth, Trade
Last updated:
apr 23, 2017
Indicators value changes by year
Minimum:
572.621 mln
jan 1, 1961
Maximum:
351.777 bln
jan 1, 2016
At the date of observation
Value
Absolute change
Change from previous value
jan 1, 1961
572.621 mln
+572.621 mln
0.0%
jan 1, 1962
670.337 mln
+97.716 mln
17.06%
jan 1, 1963
676.034 mln
+5.698 mln
0.85%
jan 1, 1964
756.372 mln
+80.338 mln
11.88%
jan 1, 1965
856.652 mln
+100.28 mln
13.26%
jan 1, 1966
950.949 mln
+94.297 mln
11.01%
jan 1, 1967
1.072 bln
+121.071 mln
12.73%
jan 1, 1968
1.174 bln
+101.645 mln
9.48%
jan 1, 1969
1.181 bln
+7.328 mln
0.62%
jan 1, 1970
1.311 bln
+130.085 mln
11.01%
jan 1, 1971
1.455 bln
+143.636 mln
10.96%
jan 1, 1972
1.648 bln
+193.251 mln
13.28%
jan 1, 1973
1.955 bln
+306.587 mln
18.6%
jan 1, 1974
2.545 bln
+590.498 mln
30.21%
jan 1, 1975
3.009 bln
+464.252 mln
18.24%
jan 1, 1976
3.625 bln
+615.597 mln
20.46%
jan 1, 1977
3.915 bln
+289.907 mln
8.0%
jan 1, 1978
4.974 bln
+1.059 bln
27.05%
jan 1, 1979
6.548 bln
+1.574 bln
31.65%
jan 1, 1980
8.154 bln
+1.606 bln
24.53%
jan 1, 1981
9.648 bln
+1.494 bln
18.32%
jan 1, 1982
8.966 bln
-682.097 mln
-7.07%
jan 1, 1983
9.242 bln
+276.264 mln
3.08%
jan 1, 1984
9.751 bln
+508.548 mln
5.5%
jan 1, 1985
10.719 bln
+968.356 mln
9.93%
jan 1, 1986
11.494 bln
+774.961 mln
7.23%
jan 1, 1987
14.099 bln
+2.605 bln
22.66%
jan 1, 1988
17.788 bln
+3.689 bln
26.17%
jan 1, 1989
20.999 bln
+3.211 bln
18.05%
jan 1, 1990
23.122 bln
+2.124 bln
10.11%
jan 1, 1991
26.973 bln
+3.851 bln
16.65%
jan 1, 1992
27.673 bln
+699.56 mln
2.59%
jan 1, 1993
32.659 bln
+4.987 bln
18.02%
jan 1, 1994
33.215 bln
+555.885 mln
1.7%
jan 1, 1995
38.804 bln
+5.588 bln
16.82%
jan 1, 1996
50.832 bln
+12.028 bln
31.0%
jan 1, 1997
56.773 bln
+5.941 bln
11.69%
jan 1, 1998
63.903 bln
+7.13 bln
12.56%
jan 1, 1999
76.133 bln
+12.23 bln
19.14%
jan 1, 2000
85.661 bln
+9.528 bln
12.51%
jan 1, 2001
94.351 bln
+8.69 bln
10.14%
jan 1, 2002
104.031 bln
+9.679 bln
10.26%
jan 1, 2003
115.762 bln
+11.731 bln
11.28%
jan 1, 2004
132.827 bln
+17.065 bln
14.74%
jan 1, 2005
156.137 bln
+23.31 bln
17.55%
jan 1, 2006
168.438 bln
+12.301 bln
7.88%
jan 1, 2007
183.351 bln
+14.913 bln
8.85%
jan 1, 2008
218.046 bln
+34.695 bln
18.92%
jan 1, 2009
231.347 bln
+13.3 bln
6.1%
jan 1, 2010
220.334 bln
-11.013 bln
-4.76%
jan 1, 2011
228.867 bln
+8.533 bln
3.87%
jan 1, 2012
246.46 bln
+17.592 bln
7.69%
jan 1, 2013
241.12 bln
-5.34 bln
-2.17%
jan 1, 2014
253.841 bln
+12.722 bln
5.28%
jan 1, 2015
291.603 bln
+37.761 bln
14.88%
jan 1, 2016
351.777 bln
+60.174 bln
20.64%
Ranking of countries by current statistics by years


Comments: