29
/
en
AIzaSyAYiBZKx7MnpbEhh9jyipgxe19OcubqV5w
April 1, 2024
152472
Hungary
HUN
true
2
1
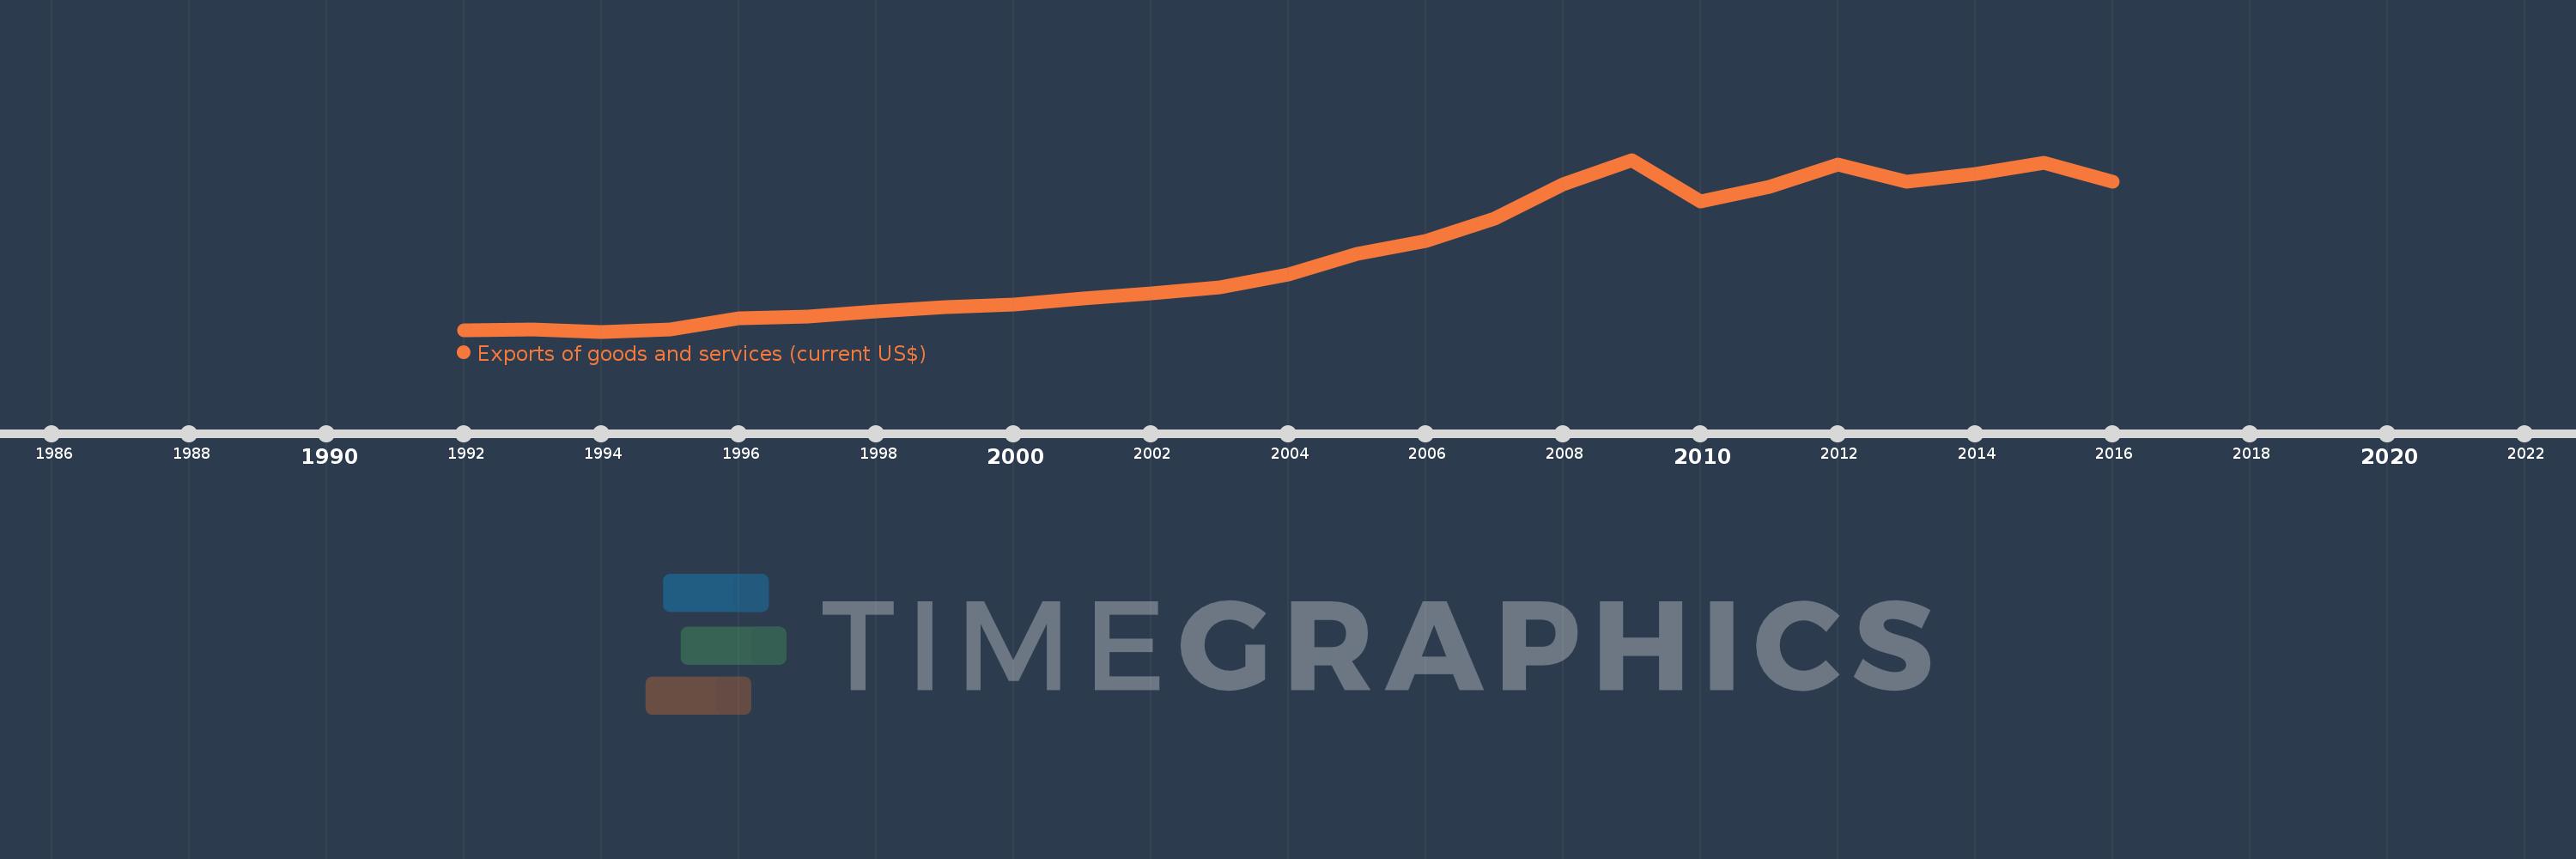
Exports of goods and services (current US$)
2016,2015,2014,2013,2012,2011,2010,2009,2008,2007,2006,2005,2004,2003,2002,2001,2000,1999,1998,1997,1996,1995,1994,1993,1992
This statistics in other country:
AfghanistanAlbaniaAlgeriaAngolaAntigua and BarbudaArab WorldArgentinaArmeniaArubaAustraliaAustriaAzerbaijanBahamas, TheBahrainBangladeshBarbadosBelarusBelgiumBelizeBeninBermudaBhutanBoliviaBosnia and HerzegovinaBotswanaBrazilBrunei DarussalamBulgariaBurkina FasoBurundiCabo VerdeCambodiaCameroonCanadaCaribbean small statesCentral African RepublicCentral Europe and the BalticsChadChileChinaColombiaComorosCongo, Dem. Rep.Congo, Rep.Costa RicaCote d'IvoireCroatiaCubaCyprusCzech RepublicDenmarkDjiboutiDominicaDominican RepublicEarly-demographic dividendEast Asia & PacificEast Asia & Pacific (excluding high income)East Asia & Pacific (IDA & IBRD countries)EcuadorEgypt, Arab Rep.El SalvadorEquatorial GuineaEritreaEstoniaEthiopiaEuro areaEurope & Central AsiaEurope & Central Asia (excluding high income)Europe & Central Asia (IDA & IBRD countries)European UnionFaroe IslandsFijiFinlandFragile and conflict affected situationsFranceFrench PolynesiaGabonGambia, TheGeorgiaGermanyGhanaGreeceGrenadaGuatemalaGuineaGuinea-BissauGuyanaHaitiHeavily indebted poor countries (HIPC)High incomeHondurasHong Kong SAR, ChinaHungaryIBRD onlyIcelandIDA & IBRD totalIDA blendIDA onlyIDA totalIndiaIndonesiaIran, Islamic Rep.IraqIrelandIsraelItalyJamaicaJapanJordanKazakhstanKenyaKiribatiKorea, Rep.KosovoKuwaitKyrgyz RepublicLao PDRLate-demographic dividendLatin America & Caribbean Latin America & Caribbean (excluding high income)Latin America & the Caribbean (IDA & IBRD countries)LatviaLeast developed countries: UN classificationLebanonLesothoLiberiaLibyaLithuaniaLow & middle incomeLow incomeLower middle incomeLuxembourgMacao SAR, ChinaMacedonia, FYRMadagascarMalawiMalaysiaMaldivesMaliMaltaMauritaniaMauritiusMexicoMicronesia, Fed. Sts.Middle East & North AfricaMiddle East & North Africa (excluding high income)Middle East & North Africa (IDA & IBRD countries)Middle incomeMoldovaMongoliaMontenegroMoroccoMozambiqueMyanmarNamibiaNepalNetherlandsNew CaledoniaNew ZealandNicaraguaNigerNigeriaNorth AmericaNorwayOECD membersOmanOther small statesPacific island small statesPakistanPalauPanamaPapua New GuineaParaguayPeruPhilippinesPolandPortugalPost-demographic dividendPre-demographic dividendPuerto RicoQatarRomaniaRussian FederationRwandaSamoaSaudi ArabiaSenegalSerbiaSeychellesSierra LeoneSingaporeSlovak RepublicSloveniaSmall statesSolomon IslandsSomaliaSouth AfricaSouth AsiaSouth Asia (IDA & IBRD)South SudanSpainSri LankaSt. Kitts and NevisSt. LuciaSt. Vincent and the GrenadinesSub-Saharan Africa Sub-Saharan Africa (excluding high income)Sub-Saharan Africa (IDA & IBRD countries)SudanSurinameSwazilandSwedenSwitzerlandSyrian Arab RepublicTajikistanTanzaniaThailandTimor-LesteTogoTongaTrinidad and TobagoTunisiaTurkeyTurkmenistanUgandaUkraineUnited Arab EmiratesUnited KingdomUnited StatesUpper middle incomeUruguayUzbekistanVanuatuVenezuela, RBVietnamWest Bank and GazaWorldYemen, Rep.ZambiaZimbabwe Timeline:
This timeline shows a graph from 1992 to 2016 of Hungary. No data until 1991. Number of actual observations by date: 25.
Source name:
World Development Indicators
Source organization:
World Bank national accounts data, and OECD National Accounts data files.
Categories, topics:
Economy & Growth, Trade
Last updated:
apr 23, 2017
Indicators value changes by year
Minimum:
9.295 bln
jan 1, 1994
Maximum:
125.276 bln
jan 1, 2009
At the date of observation
Value
Absolute change
Change from previous value
jan 1, 1992
9.986 bln
+9.986 bln
0.0%
jan 1, 1993
10.683 bln
+696.6 mln
6.98%
jan 1, 1994
9.295 bln
-1.388 bln
-12.99%
jan 1, 1995
10.952 bln
+1.657 bln
17.83%
jan 1, 1996
18.172 bln
+7.22 bln
65.93%
jan 1, 1997
19.525 bln
+1.353 bln
7.45%
jan 1, 1998
22.639 bln
+3.114 bln
15.95%
jan 1, 1999
25.774 bln
+3.135 bln
13.85%
jan 1, 2000
27.299 bln
+1.524 bln
5.91%
jan 1, 2001
31.546 bln
+4.247 bln
15.56%
jan 1, 2002
34.841 bln
+3.296 bln
10.45%
jan 1, 2003
39.257 bln
+4.416 bln
12.67%
jan 1, 2004
47.996 bln
+8.739 bln
22.26%
jan 1, 2005
61.956 bln
+13.96 bln
29.09%
jan 1, 2006
70.703 bln
+8.747 bln
14.12%
jan 1, 2007
85.298 bln
+14.595 bln
20.64%
jan 1, 2008
109.005 bln
+23.707 bln
27.79%
jan 1, 2009
125.276 bln
+16.271 bln
14.93%
jan 1, 2010
97.175 bln
-28.101 bln
-22.43%
jan 1, 2011
107.135 bln
+9.96 bln
10.25%
jan 1, 2012
122.121 bln
+14.986 bln
13.99%
jan 1, 2013
110.475 bln
-11.646 bln
-9.54%
jan 1, 2014
115.825 bln
+5.35 bln
4.84%
jan 1, 2015
123.492 bln
+7.667 bln
6.62%
jan 1, 2016
110.428 bln
-13.064 bln
-10.58%
Ranking of countries by current statistics by years


Comments: