29
/
en
AIzaSyAYiBZKx7MnpbEhh9jyipgxe19OcubqV5w
April 1, 2024
110869
Congo, Rep.
COG
true
2
1
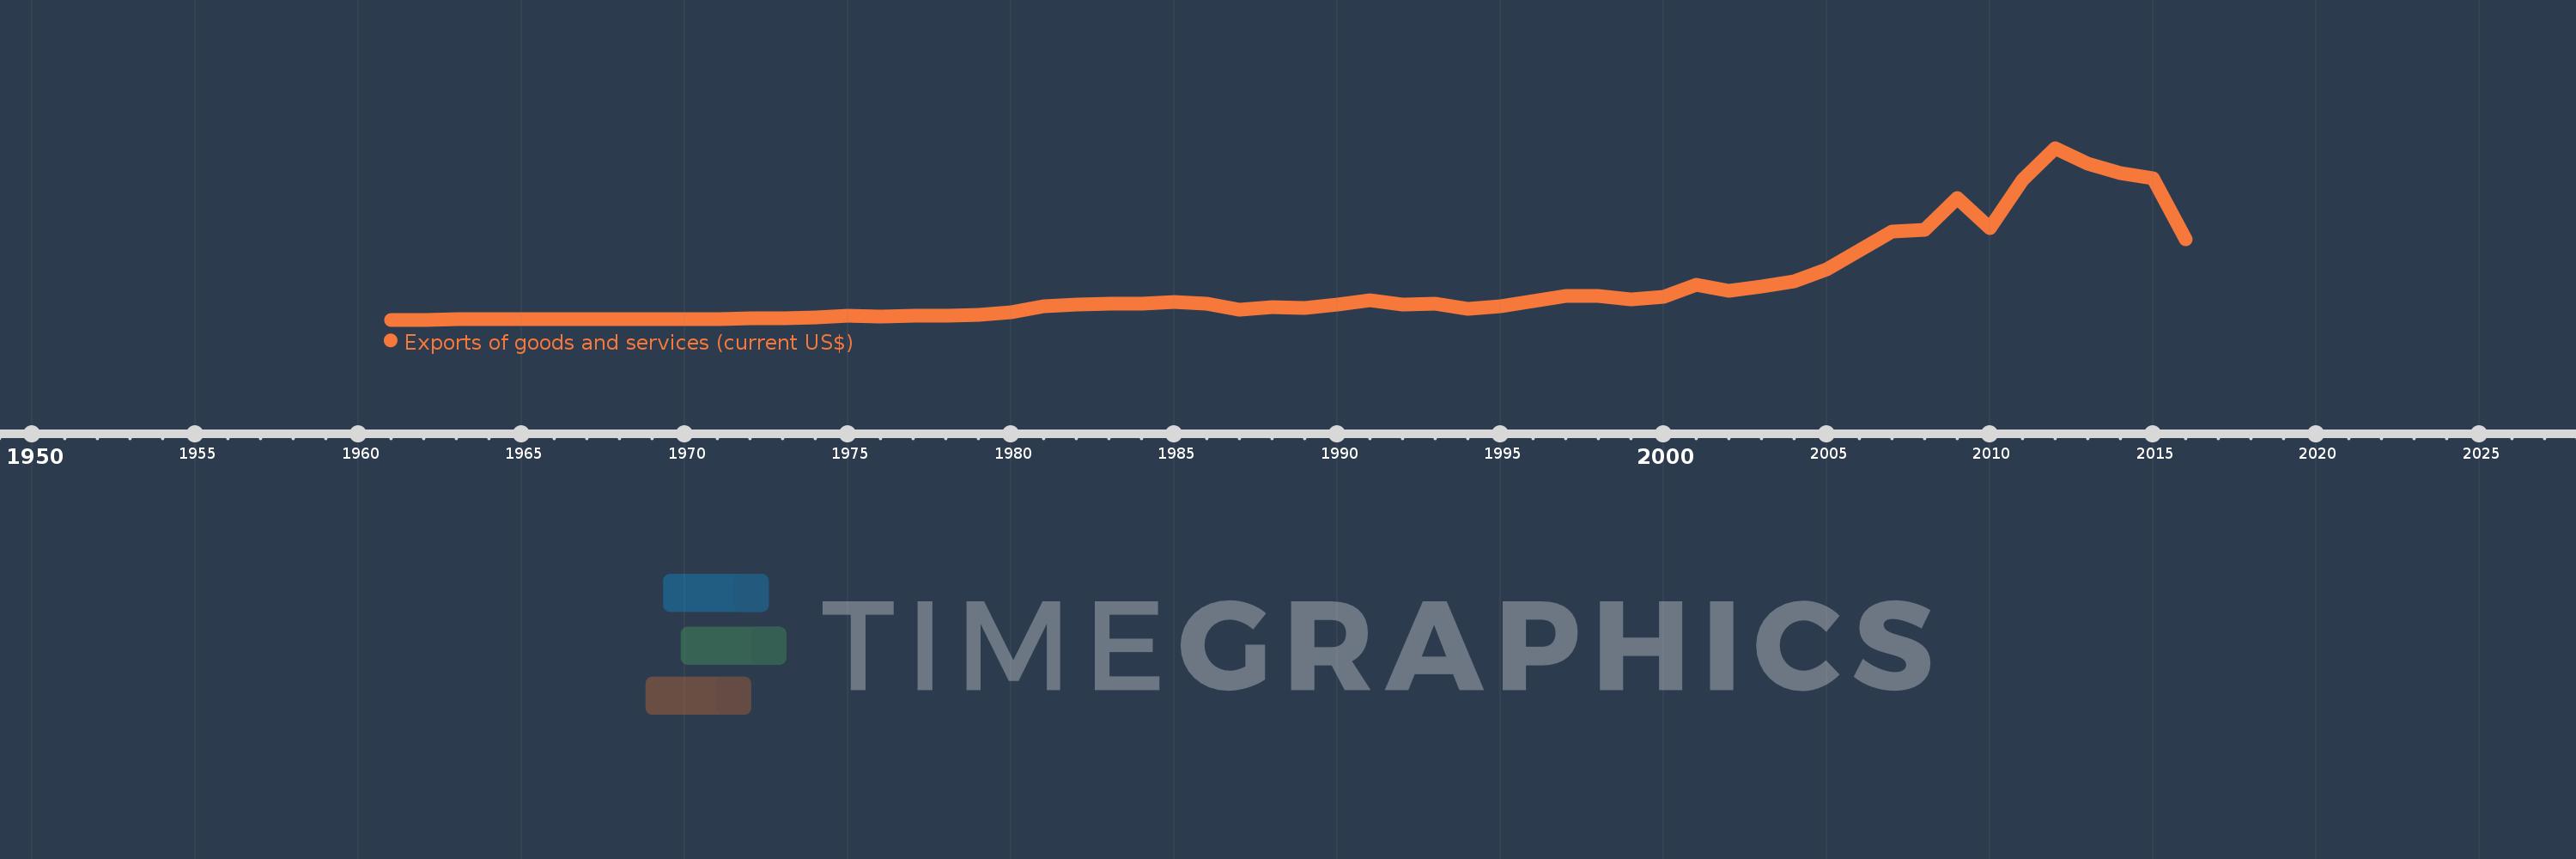
Exports of goods and services (current US$)
2016,2015,2014,2013,2012,2011,2010,2009,2008,2007,2006,2005,2004,2003,2002,2001,2000,1999,1998,1997,1996,1995,1994,1993,1992,1991,1990,1989,1988,1987,1986,1985,1984,1983,1982,1981,1980,1979,1978,1977,1976,1975,1974,1973,1972,1971,1970,1969,1968,1967,1966,1965,1964,1963,1962,1961
This statistics in other country:
AfghanistanAlbaniaAlgeriaAngolaAntigua and BarbudaArab WorldArgentinaArmeniaArubaAustraliaAustriaAzerbaijanBahamas, TheBahrainBangladeshBarbadosBelarusBelgiumBelizeBeninBermudaBhutanBoliviaBosnia and HerzegovinaBotswanaBrazilBrunei DarussalamBulgariaBurkina FasoBurundiCabo VerdeCambodiaCameroonCanadaCaribbean small statesCentral African RepublicCentral Europe and the BalticsChadChileChinaColombiaComorosCongo, Dem. Rep.Congo, Rep.Costa RicaCote d'IvoireCroatiaCubaCyprusCzech RepublicDenmarkDjiboutiDominicaDominican RepublicEarly-demographic dividendEast Asia & PacificEast Asia & Pacific (excluding high income)East Asia & Pacific (IDA & IBRD countries)EcuadorEgypt, Arab Rep.El SalvadorEquatorial GuineaEritreaEstoniaEthiopiaEuro areaEurope & Central AsiaEurope & Central Asia (excluding high income)Europe & Central Asia (IDA & IBRD countries)European UnionFaroe IslandsFijiFinlandFragile and conflict affected situationsFranceFrench PolynesiaGabonGambia, TheGeorgiaGermanyGhanaGreeceGrenadaGuatemalaGuineaGuinea-BissauGuyanaHaitiHeavily indebted poor countries (HIPC)High incomeHondurasHong Kong SAR, ChinaHungaryIBRD onlyIcelandIDA & IBRD totalIDA blendIDA onlyIDA totalIndiaIndonesiaIran, Islamic Rep.IraqIrelandIsraelItalyJamaicaJapanJordanKazakhstanKenyaKiribatiKorea, Rep.KosovoKuwaitKyrgyz RepublicLao PDRLate-demographic dividendLatin America & Caribbean Latin America & Caribbean (excluding high income)Latin America & the Caribbean (IDA & IBRD countries)LatviaLeast developed countries: UN classificationLebanonLesothoLiberiaLibyaLithuaniaLow & middle incomeLow incomeLower middle incomeLuxembourgMacao SAR, ChinaMacedonia, FYRMadagascarMalawiMalaysiaMaldivesMaliMaltaMauritaniaMauritiusMexicoMicronesia, Fed. Sts.Middle East & North AfricaMiddle East & North Africa (excluding high income)Middle East & North Africa (IDA & IBRD countries)Middle incomeMoldovaMongoliaMontenegroMoroccoMozambiqueMyanmarNamibiaNepalNetherlandsNew CaledoniaNew ZealandNicaraguaNigerNigeriaNorth AmericaNorwayOECD membersOmanOther small statesPacific island small statesPakistanPalauPanamaPapua New GuineaParaguayPeruPhilippinesPolandPortugalPost-demographic dividendPre-demographic dividendPuerto RicoQatarRomaniaRussian FederationRwandaSamoaSaudi ArabiaSenegalSerbiaSeychellesSierra LeoneSingaporeSlovak RepublicSloveniaSmall statesSolomon IslandsSomaliaSouth AfricaSouth AsiaSouth Asia (IDA & IBRD)South SudanSpainSri LankaSt. Kitts and NevisSt. LuciaSt. Vincent and the GrenadinesSub-Saharan Africa Sub-Saharan Africa (excluding high income)Sub-Saharan Africa (IDA & IBRD countries)SudanSurinameSwazilandSwedenSwitzerlandSyrian Arab RepublicTajikistanTanzaniaThailandTimor-LesteTogoTongaTrinidad and TobagoTunisiaTurkeyTurkmenistanUgandaUkraineUnited Arab EmiratesUnited KingdomUnited StatesUpper middle incomeUruguayUzbekistanVanuatuVenezuela, RBVietnamWest Bank and GazaWorldYemen, Rep.ZambiaZimbabwe Timeline:
This timeline shows a graph from 1961 to 2016 of Congo, Rep.. No data until 1960. Number of actual observations by date: 56.
Source name:
World Development Indicators
Source organization:
World Bank national accounts data, and OECD National Accounts data files.
Categories, topics:
Economy & Growth, Trade
Last updated:
apr 23, 2017
Indicators value changes by year
Minimum:
26.944 mln
jan 1, 1961
Maximum:
12.591 bln
jan 1, 2012
At the date of observation
Value
Absolute change
Change from previous value
jan 1, 1961
26.944 mln
+26.944 mln
0.0%
jan 1, 1962
29.515 mln
+2.572 mln
9.55%
jan 1, 1963
50.772 mln
+21.256 mln
72.02%
jan 1, 1964
62.819 mln
+12.047 mln
23.73%
jan 1, 1965
70.847 mln
+8.028 mln
12.78%
jan 1, 1966
71.411 mln
+563.823K
0.8%
jan 1, 1967
65.94 mln
-5.471 mln
-7.66%
jan 1, 1968
72.357 mln
+6.418 mln
9.73%
jan 1, 1969
76.344 mln
+3.986 mln
5.51%
jan 1, 1970
85.013 mln
+8.669 mln
11.36%
jan 1, 1971
95.513 mln
+10.5 mln
12.35%
jan 1, 1972
104.955 mln
+9.442 mln
9.89%
jan 1, 1973
116.257 mln
+11.302 mln
10.77%
jan 1, 1974
171.386 mln
+55.129 mln
47.42%
jan 1, 1975
311.585 mln
+140.199 mln
81.8%
jan 1, 1976
275.298 mln
-36.286 mln
-11.65%
jan 1, 1977
304.666 mln
+29.367 mln
10.67%
jan 1, 1978
348.827 mln
+44.162 mln
14.5%
jan 1, 1979
384.212 mln
+35.384 mln
10.14%
jan 1, 1980
568.348 mln
+184.137 mln
47.93%
jan 1, 1981
1.024 bln
+455.414 mln
80.13%
jan 1, 1982
1.157 bln
+132.895 mln
12.98%
jan 1, 1983
1.194 bln
+37.478 mln
3.24%
jan 1, 1984
1.215 bln
+21.141 mln
1.77%
jan 1, 1985
1.352 bln
+136.575 mln
11.24%
jan 1, 1986
1.227 bln
-124.729 mln
-9.23%
jan 1, 1987
736.632 mln
-490.489 mln
-39.97%
jan 1, 1988
958.952 mln
+222.32 mln
30.18%
jan 1, 1989
898.78 mln
-60.172 mln
-6.27%
jan 1, 1990
1.16 bln
+260.751 mln
29.01%
jan 1, 1991
1.449 bln
+289.586 mln
24.97%
jan 1, 1992
1.134 bln
-314.635 mln
-21.71%
jan 1, 1993
1.194 bln
+59.108 mln
5.21%
jan 1, 1994
822.017 mln
-371.573 mln
-31.13%
jan 1, 1995
1.035 bln
+213.363 mln
25.96%
jan 1, 1996
1.369 bln
+333.771 mln
32.24%
jan 1, 1997
1.739 bln
+370.165 mln
27.04%
jan 1, 1998
1.756 bln
+16.581 mln
0.95%
jan 1, 1999
1.487 bln
-268.879 mln
-15.31%
jan 1, 2000
1.702 bln
+214.625 mln
14.43%
jan 1, 2001
2.585 bln
+883.854 mln
51.94%
jan 1, 2002
2.163 bln
-422.18 mln
-16.33%
jan 1, 2003
2.462 bln
+298.474 mln
13.8%
jan 1, 2004
2.825 bln
+363.303 mln
14.76%
jan 1, 2005
3.744 bln
+918.437 mln
32.51%
jan 1, 2006
5.123 bln
+1.379 bln
36.84%
jan 1, 2007
6.507 bln
+1.384 bln
27.01%
jan 1, 2008
6.592 bln
+85.701 mln
1.32%
jan 1, 2009
8.912 bln
+2.32 bln
35.19%
jan 1, 2010
6.756 bln
-2.157 bln
-24.2%
jan 1, 2011
10.221 bln
+3.465 bln
51.3%
jan 1, 2012
12.591 bln
+2.37 bln
23.19%
jan 1, 2013
11.459 bln
-1.132 bln
-8.99%
jan 1, 2014
10.78 bln
-678.458 mln
-5.92%
jan 1, 2015
10.348 bln
-432.596 mln
-4.01%
jan 1, 2016
5.925 bln
-4.422 bln
-42.74%
Ranking of countries by current statistics by years


Comments: