29
/
en
AIzaSyAYiBZKx7MnpbEhh9jyipgxe19OcubqV5w
April 1, 2024
67687
Angola
AGO
true
2
1
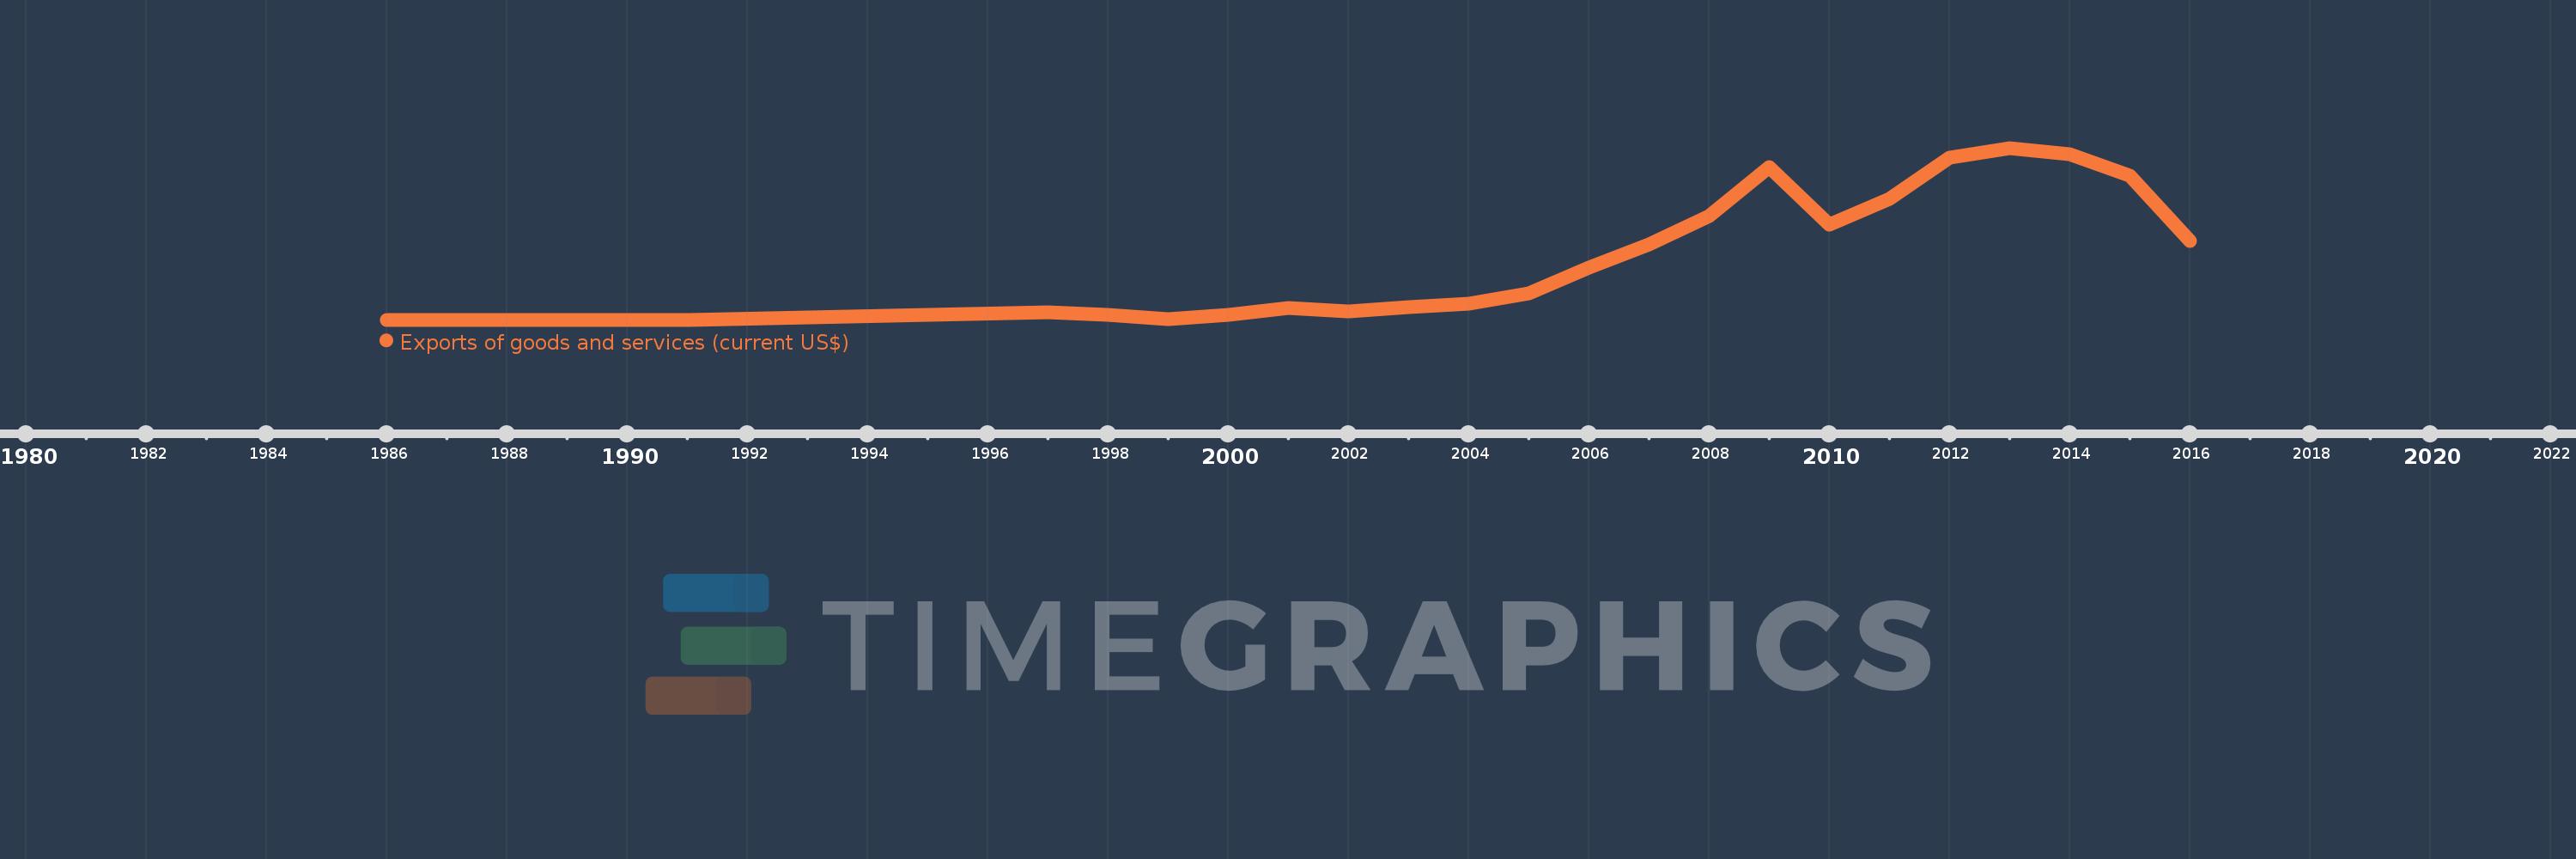
Exports of goods and services (current US$)
2016,2015,2014,2013,2012,2011,2010,2009,2008,2007,2006,2005,2004,2003,2002,2001,2000,1999,1998,1997,1995,1991,1990,1989,1988,1987,1986
This statistics in other country:
AfghanistanAlbaniaAlgeriaAngolaAntigua and BarbudaArab WorldArgentinaArmeniaArubaAustraliaAustriaAzerbaijanBahamas, TheBahrainBangladeshBarbadosBelarusBelgiumBelizeBeninBermudaBhutanBoliviaBosnia and HerzegovinaBotswanaBrazilBrunei DarussalamBulgariaBurkina FasoBurundiCabo VerdeCambodiaCameroonCanadaCaribbean small statesCentral African RepublicCentral Europe and the BalticsChadChileChinaColombiaComorosCongo, Dem. Rep.Congo, Rep.Costa RicaCote d'IvoireCroatiaCubaCyprusCzech RepublicDenmarkDjiboutiDominicaDominican RepublicEarly-demographic dividendEast Asia & PacificEast Asia & Pacific (excluding high income)East Asia & Pacific (IDA & IBRD countries)EcuadorEgypt, Arab Rep.El SalvadorEquatorial GuineaEritreaEstoniaEthiopiaEuro areaEurope & Central AsiaEurope & Central Asia (excluding high income)Europe & Central Asia (IDA & IBRD countries)European UnionFaroe IslandsFijiFinlandFragile and conflict affected situationsFranceFrench PolynesiaGabonGambia, TheGeorgiaGermanyGhanaGreeceGrenadaGuatemalaGuineaGuinea-BissauGuyanaHaitiHeavily indebted poor countries (HIPC)High incomeHondurasHong Kong SAR, ChinaHungaryIBRD onlyIcelandIDA & IBRD totalIDA blendIDA onlyIDA totalIndiaIndonesiaIran, Islamic Rep.IraqIrelandIsraelItalyJamaicaJapanJordanKazakhstanKenyaKiribatiKorea, Rep.KosovoKuwaitKyrgyz RepublicLao PDRLate-demographic dividendLatin America & Caribbean Latin America & Caribbean (excluding high income)Latin America & the Caribbean (IDA & IBRD countries)LatviaLeast developed countries: UN classificationLebanonLesothoLiberiaLibyaLithuaniaLow & middle incomeLow incomeLower middle incomeLuxembourgMacao SAR, ChinaMacedonia, FYRMadagascarMalawiMalaysiaMaldivesMaliMaltaMauritaniaMauritiusMexicoMicronesia, Fed. Sts.Middle East & North AfricaMiddle East & North Africa (excluding high income)Middle East & North Africa (IDA & IBRD countries)Middle incomeMoldovaMongoliaMontenegroMoroccoMozambiqueMyanmarNamibiaNepalNetherlandsNew CaledoniaNew ZealandNicaraguaNigerNigeriaNorth AmericaNorwayOECD membersOmanOther small statesPacific island small statesPakistanPalauPanamaPapua New GuineaParaguayPeruPhilippinesPolandPortugalPost-demographic dividendPre-demographic dividendPuerto RicoQatarRomaniaRussian FederationRwandaSamoaSaudi ArabiaSenegalSerbiaSeychellesSierra LeoneSingaporeSlovak RepublicSloveniaSmall statesSolomon IslandsSomaliaSouth AfricaSouth AsiaSouth Asia (IDA & IBRD)South SudanSpainSri LankaSt. Kitts and NevisSt. LuciaSt. Vincent and the GrenadinesSub-Saharan Africa Sub-Saharan Africa (excluding high income)Sub-Saharan Africa (IDA & IBRD countries)SudanSurinameSwazilandSwedenSwitzerlandSyrian Arab RepublicTajikistanTanzaniaThailandTimor-LesteTogoTongaTrinidad and TobagoTunisiaTurkeyTurkmenistanUgandaUkraineUnited Arab EmiratesUnited KingdomUnited StatesUpper middle incomeUruguayUzbekistanVanuatuVenezuela, RBVietnamWest Bank and GazaWorldYemen, Rep.ZambiaZimbabwe Timeline:
This timeline shows a graph from 1986 to 2016 of Angola. No data until 1985. Number of actual observations by date: 27.
Source name:
World Development Indicators
Source organization:
World Bank national accounts data, and OECD National Accounts data files.
Categories, topics:
Economy & Growth, Trade
Last updated:
apr 23, 2017
Indicators value changes by year
Minimum:
3.344 bln
jan 1, 1986
Maximum:
71.909 bln
jan 1, 2013
At the date of observation
Value
Absolute change
Change from previous value
jan 1, 1986
3.344 bln
+3.344 bln
0.0%
jan 1, 1987
3.344 bln
0.0
0.0%
jan 1, 1988
3.344 bln
0.0
0.0%
jan 1, 1989
3.344 bln
0.0
0.0%
jan 1, 1990
3.344 bln
0.0
0.0%
jan 1, 1991
3.344 bln
0.0
0.0%
jan 1, 1995
5.294 bln
+1.95 bln
58.29%
jan 1, 1997
6.226 bln
+932.475 mln
17.61%
jan 1, 1998
5.239 bln
-987.036 mln
-15.85%
jan 1, 1999
3.656 bln
-1.583 bln
-30.22%
jan 1, 2000
5.31 bln
+1.654 bln
45.23%
jan 1, 2001
8.183 bln
+2.873 bln
54.11%
jan 1, 2002
6.737 bln
-1.446 bln
-17.67%
jan 1, 2003
8.535 bln
+1.798 bln
26.69%
jan 1, 2004
9.709 bln
+1.174 bln
13.76%
jan 1, 2005
13.798 bln
+4.089 bln
42.12%
jan 1, 2006
24.286 bln
+10.488 bln
76.02%
jan 1, 2007
33.346 bln
+9.06 bln
37.31%
jan 1, 2008
44.707 bln
+11.36 bln
34.07%
jan 1, 2009
64.243 bln
+19.536 bln
43.7%
jan 1, 2010
41.451 bln
-22.792 bln
-35.48%
jan 1, 2011
51.452 bln
+10.001 bln
24.13%
jan 1, 2012
68.043 bln
+16.591 bln
32.25%
jan 1, 2013
71.909 bln
+3.866 bln
5.68%
jan 1, 2014
69.562 bln
-2.346 bln
-3.26%
jan 1, 2015
60.851 bln
-8.711 bln
-12.52%
jan 1, 2016
34.818 bln
-26.033 bln
-42.78%
Ranking of countries by current statistics by years


Comments: