29
/
en
AIzaSyAYiBZKx7MnpbEhh9jyipgxe19OcubqV5w
April 1, 2024
202853
Mozambique
MOZ
true
2
1
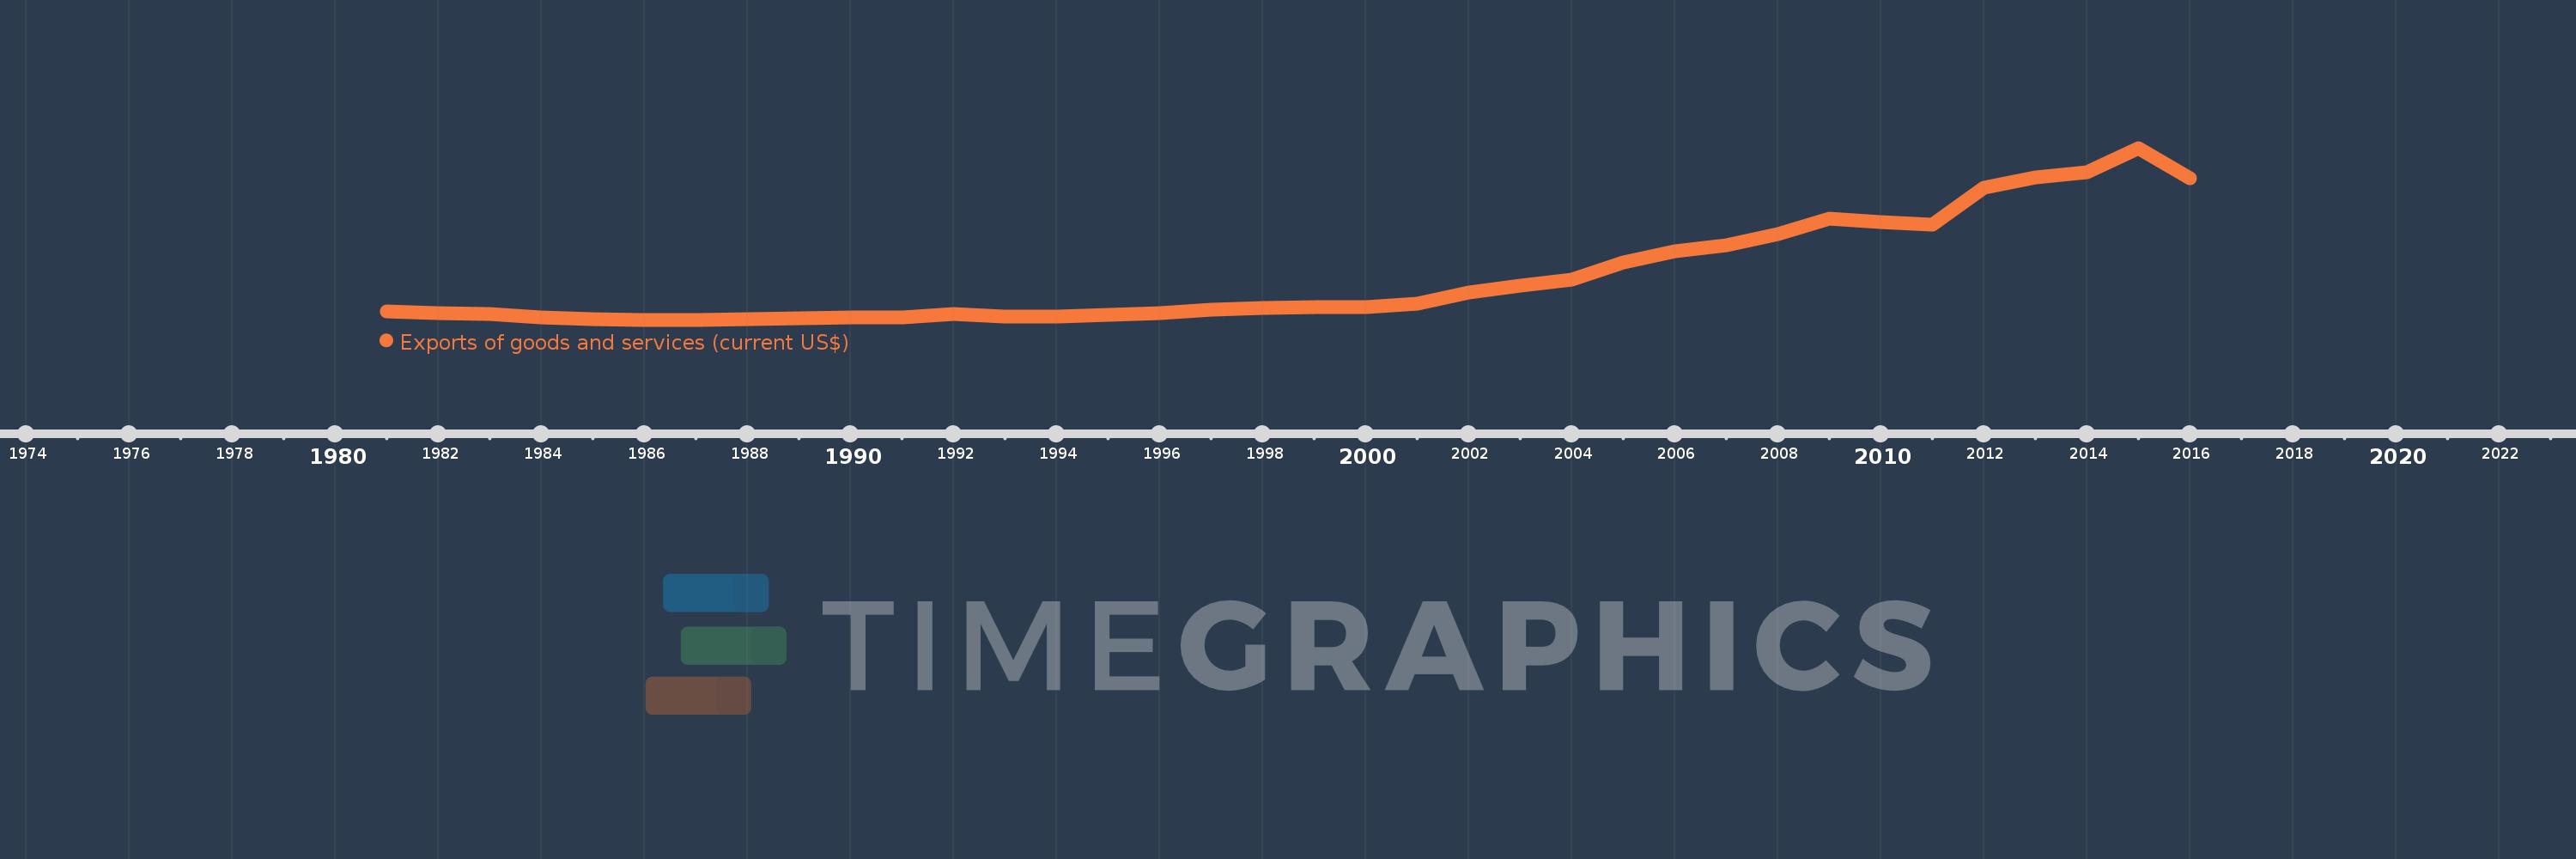
Exports of goods and services (current US$)
2016,2015,2014,2013,2012,2011,2010,2009,2008,2007,2006,2005,2004,2003,2002,2001,2000,1999,1998,1997,1996,1995,1994,1993,1992,1991,1990,1989,1988,1987,1986,1985,1984,1983,1982,1981
This statistics in other country:
AfghanistanAlbaniaAlgeriaAngolaAntigua and BarbudaArab WorldArgentinaArmeniaArubaAustraliaAustriaAzerbaijanBahamas, TheBahrainBangladeshBarbadosBelarusBelgiumBelizeBeninBermudaBhutanBoliviaBosnia and HerzegovinaBotswanaBrazilBrunei DarussalamBulgariaBurkina FasoBurundiCabo VerdeCambodiaCameroonCanadaCaribbean small statesCentral African RepublicCentral Europe and the BalticsChadChileChinaColombiaComorosCongo, Dem. Rep.Congo, Rep.Costa RicaCote d'IvoireCroatiaCubaCyprusCzech RepublicDenmarkDjiboutiDominicaDominican RepublicEarly-demographic dividendEast Asia & PacificEast Asia & Pacific (excluding high income)East Asia & Pacific (IDA & IBRD countries)EcuadorEgypt, Arab Rep.El SalvadorEquatorial GuineaEritreaEstoniaEthiopiaEuro areaEurope & Central AsiaEurope & Central Asia (excluding high income)Europe & Central Asia (IDA & IBRD countries)European UnionFaroe IslandsFijiFinlandFragile and conflict affected situationsFranceFrench PolynesiaGabonGambia, TheGeorgiaGermanyGhanaGreeceGrenadaGuatemalaGuineaGuinea-BissauGuyanaHaitiHeavily indebted poor countries (HIPC)High incomeHondurasHong Kong SAR, ChinaHungaryIBRD onlyIcelandIDA & IBRD totalIDA blendIDA onlyIDA totalIndiaIndonesiaIran, Islamic Rep.IraqIrelandIsraelItalyJamaicaJapanJordanKazakhstanKenyaKiribatiKorea, Rep.KosovoKuwaitKyrgyz RepublicLao PDRLate-demographic dividendLatin America & Caribbean Latin America & Caribbean (excluding high income)Latin America & the Caribbean (IDA & IBRD countries)LatviaLeast developed countries: UN classificationLebanonLesothoLiberiaLibyaLithuaniaLow & middle incomeLow incomeLower middle incomeLuxembourgMacao SAR, ChinaMacedonia, FYRMadagascarMalawiMalaysiaMaldivesMaliMaltaMauritaniaMauritiusMexicoMicronesia, Fed. Sts.Middle East & North AfricaMiddle East & North Africa (excluding high income)Middle East & North Africa (IDA & IBRD countries)Middle incomeMoldovaMongoliaMontenegroMoroccoMozambiqueMyanmarNamibiaNepalNetherlandsNew CaledoniaNew ZealandNicaraguaNigerNigeriaNorth AmericaNorwayOECD membersOmanOther small statesPacific island small statesPakistanPalauPanamaPapua New GuineaParaguayPeruPhilippinesPolandPortugalPost-demographic dividendPre-demographic dividendPuerto RicoQatarRomaniaRussian FederationRwandaSamoaSaudi ArabiaSenegalSerbiaSeychellesSierra LeoneSingaporeSlovak RepublicSloveniaSmall statesSolomon IslandsSomaliaSouth AfricaSouth AsiaSouth Asia (IDA & IBRD)South SudanSpainSri LankaSt. Kitts and NevisSt. LuciaSt. Vincent and the GrenadinesSub-Saharan Africa Sub-Saharan Africa (excluding high income)Sub-Saharan Africa (IDA & IBRD countries)SudanSurinameSwazilandSwedenSwitzerlandSyrian Arab RepublicTajikistanTanzaniaThailandTimor-LesteTogoTongaTrinidad and TobagoTunisiaTurkeyTurkmenistanUgandaUkraineUnited Arab EmiratesUnited KingdomUnited StatesUpper middle incomeUruguayUzbekistanVanuatuVenezuela, RBVietnamWest Bank and GazaWorldYemen, Rep.ZambiaZimbabwe Timeline:
This timeline shows a graph from 1981 to 2016 of Mozambique. No data until 1980. Number of actual observations by date: 36.
Source name:
World Development Indicators
Source organization:
World Bank national accounts data, and OECD National Accounts data files.
Categories, topics:
Economy & Growth, Trade
Last updated:
apr 23, 2017
Indicators value changes by year
Minimum:
127.488 mln
jan 1, 1986
Maximum:
5.658 bln
jan 1, 2015
At the date of observation
Value
Absolute change
Change from previous value
jan 1, 1981
383.019 mln
+383.019 mln
0.0%
jan 1, 1982
351.434 mln
-31.585 mln
-8.25%
jan 1, 1983
300.545 mln
-50.889 mln
-14.48%
jan 1, 1984
198.057 mln
-102.488 mln
-34.1%
jan 1, 1985
139.824 mln
-58.234 mln
-29.4%
jan 1, 1986
127.488 mln
-12.336 mln
-8.82%
jan 1, 1987
132.38 mln
+4.893 mln
3.84%
jan 1, 1988
156.324 mln
+23.944 mln
18.09%
jan 1, 1989
168.956 mln
+12.632 mln
8.08%
jan 1, 1990
190.3 mln
+21.344 mln
12.63%
jan 1, 1991
205.342 mln
+15.042 mln
7.9%
jan 1, 1992
299.41 mln
+94.068 mln
45.81%
jan 1, 1993
243.064 mln
-56.345 mln
-18.82%
jan 1, 1994
224.944 mln
-18.121 mln
-7.46%
jan 1, 1995
295.249 mln
+70.305 mln
31.25%
jan 1, 1996
333.236 mln
+37.987 mln
12.87%
jan 1, 1997
464.288 mln
+131.052 mln
39.33%
jan 1, 1998
507.564 mln
+43.276 mln
9.32%
jan 1, 1999
532.691 mln
+25.127 mln
4.95%
jan 1, 2000
539.043 mln
+6.353 mln
1.19%
jan 1, 2001
643.7 mln
+104.656 mln
19.42%
jan 1, 2002
1.007 bln
+362.934 mln
56.38%
jan 1, 2003
1.228 bln
+221.579 mln
22.01%
jan 1, 2004
1.431 bln
+202.712 mln
16.5%
jan 1, 2005
1.976 bln
+545.18 mln
38.1%
jan 1, 2006
2.332 bln
+355.76 mln
18.0%
jan 1, 2007
2.512 bln
+179.786 mln
7.71%
jan 1, 2008
2.888 bln
+376.798 mln
15.0%
jan 1, 2009
3.372 bln
+483.812 mln
16.75%
jan 1, 2010
3.27 bln
-102.078 mln
-3.03%
jan 1, 2011
3.2 bln
-70.56 mln
-2.16%
jan 1, 2012
4.389 bln
+1.19 bln
37.18%
jan 1, 2013
4.706 bln
+316.322 mln
7.21%
jan 1, 2014
4.865 bln
+159.176 mln
3.38%
jan 1, 2015
5.658 bln
+793.295 mln
16.31%
jan 1, 2016
4.691 bln
-967.082 mln
-17.09%
Ranking of countries by current statistics by years


Comments: