29
/
en
AIzaSyAYiBZKx7MnpbEhh9jyipgxe19OcubqV5w
April 1, 2024
64641
Albania
ALB
true
2
1
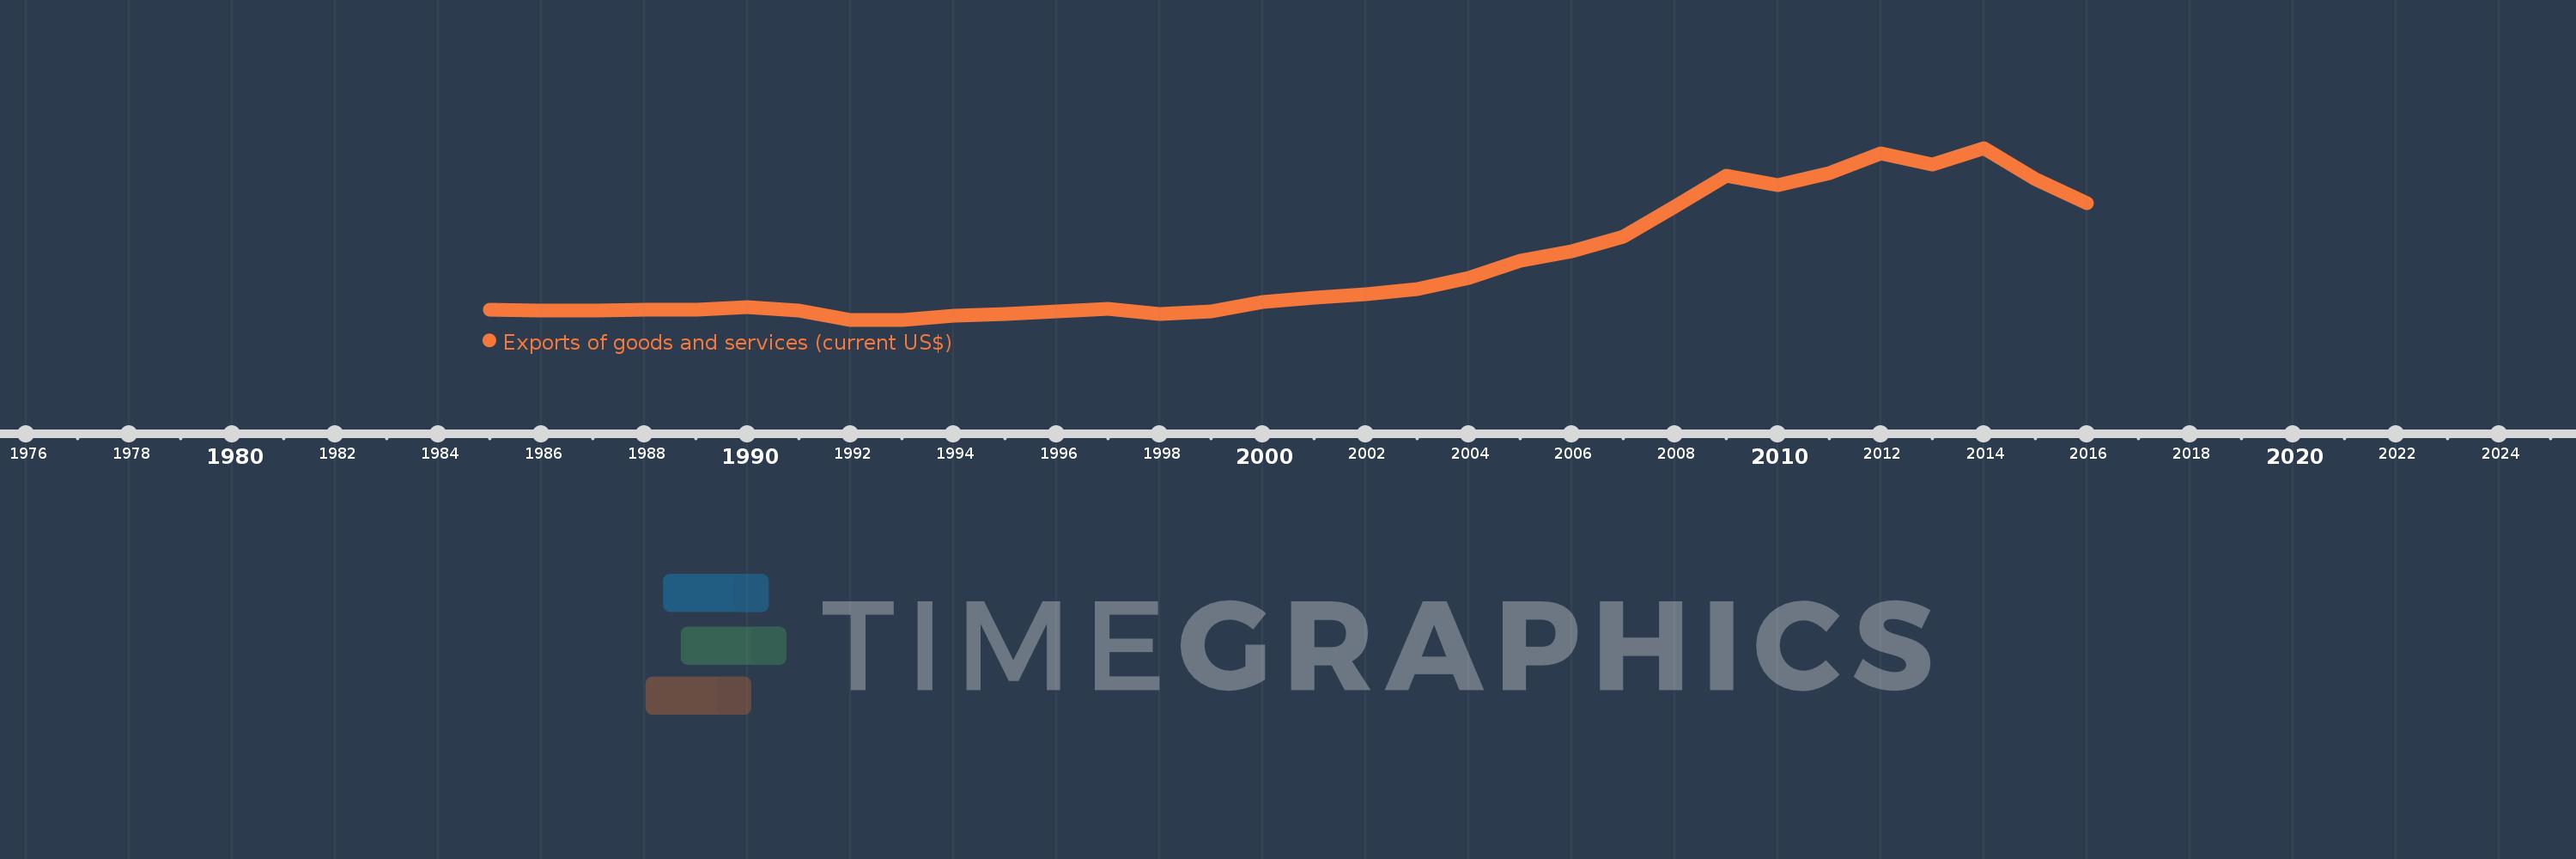
Exports of goods and services (current US$)
2016,2015,2014,2013,2012,2011,2010,2009,2008,2007,2006,2005,2004,2003,2002,2001,2000,1999,1998,1997,1996,1995,1994,1993,1992,1991,1990,1989,1988,1987,1986,1985
This statistics in other country:
AfghanistanAlbaniaAlgeriaAngolaAntigua and BarbudaArab WorldArgentinaArmeniaArubaAustraliaAustriaAzerbaijanBahamas, TheBahrainBangladeshBarbadosBelarusBelgiumBelizeBeninBermudaBhutanBoliviaBosnia and HerzegovinaBotswanaBrazilBrunei DarussalamBulgariaBurkina FasoBurundiCabo VerdeCambodiaCameroonCanadaCaribbean small statesCentral African RepublicCentral Europe and the BalticsChadChileChinaColombiaComorosCongo, Dem. Rep.Congo, Rep.Costa RicaCote d'IvoireCroatiaCubaCyprusCzech RepublicDenmarkDjiboutiDominicaDominican RepublicEarly-demographic dividendEast Asia & PacificEast Asia & Pacific (excluding high income)East Asia & Pacific (IDA & IBRD countries)EcuadorEgypt, Arab Rep.El SalvadorEquatorial GuineaEritreaEstoniaEthiopiaEuro areaEurope & Central AsiaEurope & Central Asia (excluding high income)Europe & Central Asia (IDA & IBRD countries)European UnionFaroe IslandsFijiFinlandFragile and conflict affected situationsFranceFrench PolynesiaGabonGambia, TheGeorgiaGermanyGhanaGreeceGrenadaGuatemalaGuineaGuinea-BissauGuyanaHaitiHeavily indebted poor countries (HIPC)High incomeHondurasHong Kong SAR, ChinaHungaryIBRD onlyIcelandIDA & IBRD totalIDA blendIDA onlyIDA totalIndiaIndonesiaIran, Islamic Rep.IraqIrelandIsraelItalyJamaicaJapanJordanKazakhstanKenyaKiribatiKorea, Rep.KosovoKuwaitKyrgyz RepublicLao PDRLate-demographic dividendLatin America & Caribbean Latin America & Caribbean (excluding high income)Latin America & the Caribbean (IDA & IBRD countries)LatviaLeast developed countries: UN classificationLebanonLesothoLiberiaLibyaLithuaniaLow & middle incomeLow incomeLower middle incomeLuxembourgMacao SAR, ChinaMacedonia, FYRMadagascarMalawiMalaysiaMaldivesMaliMaltaMauritaniaMauritiusMexicoMicronesia, Fed. Sts.Middle East & North AfricaMiddle East & North Africa (excluding high income)Middle East & North Africa (IDA & IBRD countries)Middle incomeMoldovaMongoliaMontenegroMoroccoMozambiqueMyanmarNamibiaNepalNetherlandsNew CaledoniaNew ZealandNicaraguaNigerNigeriaNorth AmericaNorwayOECD membersOmanOther small statesPacific island small statesPakistanPalauPanamaPapua New GuineaParaguayPeruPhilippinesPolandPortugalPost-demographic dividendPre-demographic dividendPuerto RicoQatarRomaniaRussian FederationRwandaSamoaSaudi ArabiaSenegalSerbiaSeychellesSierra LeoneSingaporeSlovak RepublicSloveniaSmall statesSolomon IslandsSomaliaSouth AfricaSouth AsiaSouth Asia (IDA & IBRD)South SudanSpainSri LankaSt. Kitts and NevisSt. LuciaSt. Vincent and the GrenadinesSub-Saharan Africa Sub-Saharan Africa (excluding high income)Sub-Saharan Africa (IDA & IBRD countries)SudanSurinameSwazilandSwedenSwitzerlandSyrian Arab RepublicTajikistanTanzaniaThailandTimor-LesteTogoTongaTrinidad and TobagoTunisiaTurkeyTurkmenistanUgandaUkraineUnited Arab EmiratesUnited KingdomUnited StatesUpper middle incomeUruguayUzbekistanVanuatuVenezuela, RBVietnamWest Bank and GazaWorldYemen, Rep.ZambiaZimbabwe Timeline:
This timeline shows a graph from 1985 to 2016 of Albania. No data until 1984. Number of actual observations by date: 32.
Source name:
World Development Indicators
Source organization:
World Bank national accounts data, and OECD National Accounts data files.
Categories, topics:
Economy & Growth, Trade
Last updated:
apr 23, 2017
Indicators value changes by year
Minimum:
81.519 mln
jan 1, 1993
Maximum:
4.531 bln
jan 1, 2014
At the date of observation
Value
Absolute change
Change from previous value
jan 1, 1985
335.07 mln
+335.07 mln
0.0%
jan 1, 1986
319.091 mln
-15.979 mln
-4.77%
jan 1, 1987
327.313 mln
+8.222 mln
2.58%
jan 1, 1988
333.55 mln
+6.237 mln
1.91%
jan 1, 1989
348.287 mln
+14.737 mln
4.42%
jan 1, 1990
418.925 mln
+70.638 mln
20.28%
jan 1, 1991
312.5 mln
-106.425 mln
-25.4%
jan 1, 1992
82.3 mln
-230.2 mln
-73.66%
jan 1, 1993
81.519 mln
-780.79K
-0.95%
jan 1, 1994
189.4 mln
+107.88 mln
132.34%
jan 1, 1995
225.407 mln
+36.008 mln
19.01%
jan 1, 1996
302.465 mln
+77.058 mln
34.19%
jan 1, 1997
371.128 mln
+68.663 mln
22.7%
jan 1, 1998
229.988 mln
-141.14 mln
-38.03%
jan 1, 1999
293.569 mln
+63.581 mln
27.65%
jan 1, 2000
540.104 mln
+246.535 mln
83.98%
jan 1, 2001
648.94 mln
+108.837 mln
20.15%
jan 1, 2002
748.462 mln
+99.521 mln
15.34%
jan 1, 2003
869.225 mln
+120.764 mln
16.13%
jan 1, 2004
1.17 bln
+300.618 mln
34.58%
jan 1, 2005
1.608 bln
+438.179 mln
37.46%
jan 1, 2006
1.862 bln
+254.091 mln
15.8%
jan 1, 2007
2.242 bln
+380.112 mln
20.41%
jan 1, 2008
3.005 bln
+763.071 mln
34.03%
jan 1, 2009
3.812 bln
+806.326 mln
26.83%
jan 1, 2010
3.565 bln
-246.43 mln
-6.47%
jan 1, 2011
3.869 bln
+303.914 mln
8.52%
jan 1, 2012
4.385 bln
+515.553 mln
13.32%
jan 1, 2013
4.109 bln
-275.809 mln
-6.29%
jan 1, 2014
4.531 bln
+421.904 mln
10.27%
jan 1, 2015
3.732 bln
-798.669 mln
-17.63%
jan 1, 2016
3.099 bln
-632.981 mln
-16.96%
Ranking of countries by current statistics by years


Comments: