29
/
en
AIzaSyAYiBZKx7MnpbEhh9jyipgxe19OcubqV5w
April 1, 2024
209268
New Zealand
NZL
true
2
1
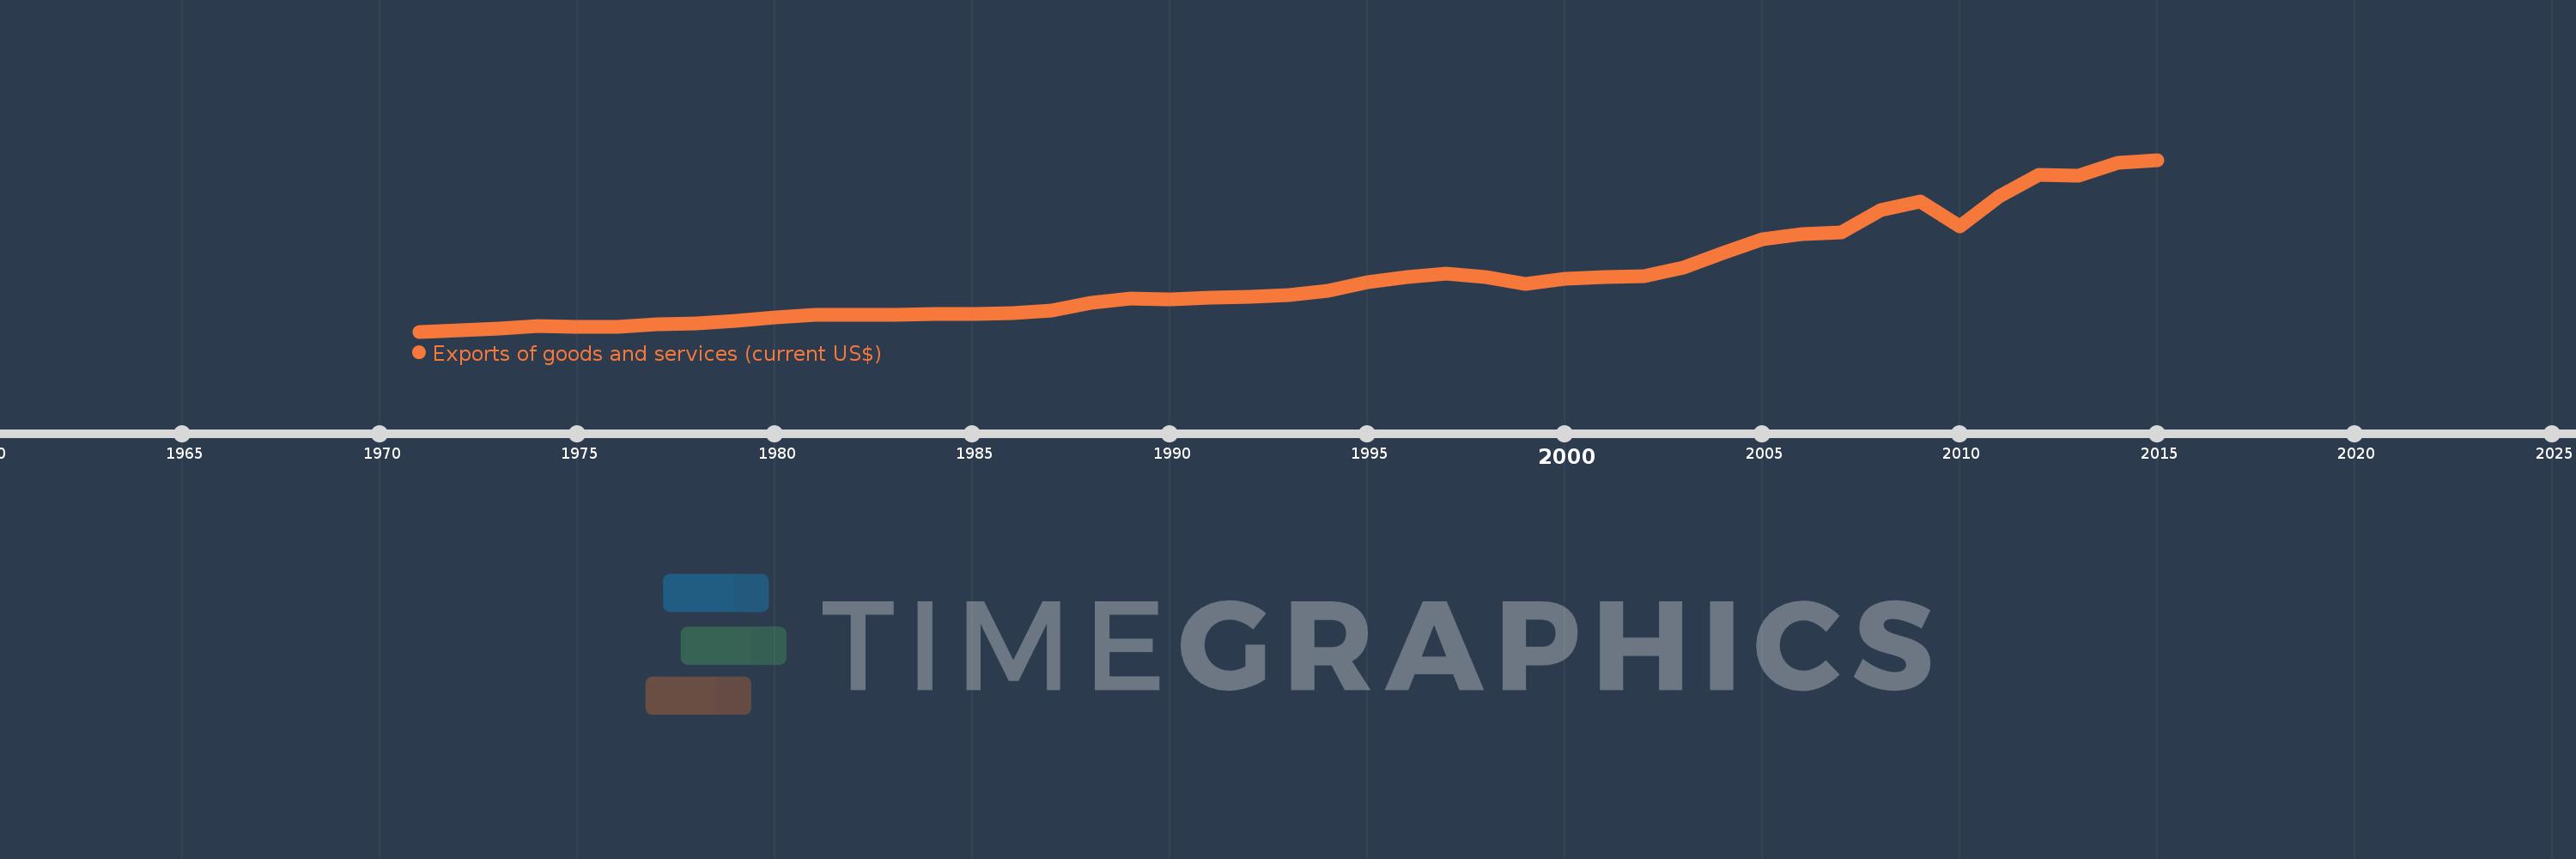
Exports of goods and services (current US$)
2015,2014,2013,2012,2011,2010,2009,2008,2007,2006,2005,2004,2003,2002,2001,2000,1999,1998,1997,1996,1995,1994,1993,1992,1991,1990,1989,1988,1987,1986,1985,1984,1983,1982,1981,1980,1979,1978,1977,1976,1975,1974,1973,1972,1971
This statistics in other country:
AfghanistanAlbaniaAlgeriaAngolaAntigua and BarbudaArab WorldArgentinaArmeniaArubaAustraliaAustriaAzerbaijanBahamas, TheBahrainBangladeshBarbadosBelarusBelgiumBelizeBeninBermudaBhutanBoliviaBosnia and HerzegovinaBotswanaBrazilBrunei DarussalamBulgariaBurkina FasoBurundiCabo VerdeCambodiaCameroonCanadaCaribbean small statesCentral African RepublicCentral Europe and the BalticsChadChileChinaColombiaComorosCongo, Dem. Rep.Congo, Rep.Costa RicaCote d'IvoireCroatiaCubaCyprusCzech RepublicDenmarkDjiboutiDominicaDominican RepublicEarly-demographic dividendEast Asia & PacificEast Asia & Pacific (excluding high income)East Asia & Pacific (IDA & IBRD countries)EcuadorEgypt, Arab Rep.El SalvadorEquatorial GuineaEritreaEstoniaEthiopiaEuro areaEurope & Central AsiaEurope & Central Asia (excluding high income)Europe & Central Asia (IDA & IBRD countries)European UnionFaroe IslandsFijiFinlandFragile and conflict affected situationsFranceFrench PolynesiaGabonGambia, TheGeorgiaGermanyGhanaGreeceGrenadaGuatemalaGuineaGuinea-BissauGuyanaHaitiHeavily indebted poor countries (HIPC)High incomeHondurasHong Kong SAR, ChinaHungaryIBRD onlyIcelandIDA & IBRD totalIDA blendIDA onlyIDA totalIndiaIndonesiaIran, Islamic Rep.IraqIrelandIsraelItalyJamaicaJapanJordanKazakhstanKenyaKiribatiKorea, Rep.KosovoKuwaitKyrgyz RepublicLao PDRLate-demographic dividendLatin America & Caribbean Latin America & Caribbean (excluding high income)Latin America & the Caribbean (IDA & IBRD countries)LatviaLeast developed countries: UN classificationLebanonLesothoLiberiaLibyaLithuaniaLow & middle incomeLow incomeLower middle incomeLuxembourgMacao SAR, ChinaMacedonia, FYRMadagascarMalawiMalaysiaMaldivesMaliMaltaMauritaniaMauritiusMexicoMicronesia, Fed. Sts.Middle East & North AfricaMiddle East & North Africa (excluding high income)Middle East & North Africa (IDA & IBRD countries)Middle incomeMoldovaMongoliaMontenegroMoroccoMozambiqueMyanmarNamibiaNepalNetherlandsNew CaledoniaNew ZealandNicaraguaNigerNigeriaNorth AmericaNorwayOECD membersOmanOther small statesPacific island small statesPakistanPalauPanamaPapua New GuineaParaguayPeruPhilippinesPolandPortugalPost-demographic dividendPre-demographic dividendPuerto RicoQatarRomaniaRussian FederationRwandaSamoaSaudi ArabiaSenegalSerbiaSeychellesSierra LeoneSingaporeSlovak RepublicSloveniaSmall statesSolomon IslandsSomaliaSouth AfricaSouth AsiaSouth Asia (IDA & IBRD)South SudanSpainSri LankaSt. Kitts and NevisSt. LuciaSt. Vincent and the GrenadinesSub-Saharan Africa Sub-Saharan Africa (excluding high income)Sub-Saharan Africa (IDA & IBRD countries)SudanSurinameSwazilandSwedenSwitzerlandSyrian Arab RepublicTajikistanTanzaniaThailandTimor-LesteTogoTongaTrinidad and TobagoTunisiaTurkeyTurkmenistanUgandaUkraineUnited Arab EmiratesUnited KingdomUnited StatesUpper middle incomeUruguayUzbekistanVanuatuVenezuela, RBVietnamWest Bank and GazaWorldYemen, Rep.ZambiaZimbabwe Timeline:
This timeline shows a graph from 1971 to 2015 of New Zealand. No data until 1970. Number of actual observations by date: 45.
Source name:
World Development Indicators
Source organization:
World Bank national accounts data, and OECD National Accounts data files.
Categories, topics:
Economy & Growth, Trade
Last updated:
apr 23, 2017
Indicators value changes by year
Minimum:
1.435 bln
jan 1, 1971
Maximum:
55.981 bln
jan 1, 2015
At the date of observation
Value
Absolute change
Change from previous value
jan 1, 1971
1.435 bln
+1.435 bln
0.0%
jan 1, 1972
1.78 bln
+344.87 mln
24.04%
jan 1, 1973
2.34 bln
+559.999 mln
31.47%
jan 1, 1974
3.074 bln
+734.033 mln
31.37%
jan 1, 1975
2.875 bln
-198.536 mln
-6.46%
jan 1, 1976
2.972 bln
+96.469 mln
3.36%
jan 1, 1977
3.63 bln
+658.625 mln
22.16%
jan 1, 1978
4.039 bln
+408.545 mln
11.25%
jan 1, 1979
4.937 bln
+898.583 mln
22.25%
jan 1, 1980
5.935 bln
+997.799 mln
20.21%
jan 1, 1981
6.696 bln
+760.529 mln
12.81%
jan 1, 1982
6.819 bln
+123.131 mln
1.84%
jan 1, 1983
6.702 bln
-116.637 mln
-1.71%
jan 1, 1984
6.906 bln
+203.776 mln
3.04%
jan 1, 1985
6.892 bln
-13.842 mln
-0.2%
jan 1, 1986
7.232 bln
+340.179 mln
4.94%
jan 1, 1987
8.152 bln
+919.972 mln
12.72%
jan 1, 1988
10.547 bln
+2.395 bln
29.38%
jan 1, 1989
11.833 bln
+1.286 bln
12.19%
jan 1, 1990
11.573 bln
-260.112 mln
-2.2%
jan 1, 1991
12.175 bln
+602.282 mln
5.2%
jan 1, 1992
12.465 bln
+289.772 mln
2.38%
jan 1, 1993
12.991 bln
+526.167 mln
4.22%
jan 1, 1994
14.314 bln
+1.323 bln
10.19%
jan 1, 1995
17.025 bln
+2.71 bln
18.93%
jan 1, 1996
18.788 bln
+1.763 bln
10.36%
jan 1, 1997
19.884 bln
+1.096 bln
5.84%
jan 1, 1998
18.713 bln
-1.171 bln
-5.89%
jan 1, 1999
16.653 bln
-2.06 bln
-11.01%
jan 1, 2000
18.187 bln
+1.534 bln
9.21%
jan 1, 2001
18.81 bln
+623.19 mln
3.43%
jan 1, 2002
19.088 bln
+277.127 mln
1.47%
jan 1, 2003
21.885 bln
+2.798 bln
14.66%
jan 1, 2004
26.334 bln
+4.449 bln
20.33%
jan 1, 2005
30.697 bln
+4.363 bln
16.57%
jan 1, 2006
32.449 bln
+1.752 bln
5.71%
jan 1, 2007
33.025 bln
+576.317 mln
1.78%
jan 1, 2008
40.159 bln
+7.134 bln
21.6%
jan 1, 2009
42.707 bln
+2.547 bln
6.34%
jan 1, 2010
34.875 bln
-7.831 bln
-18.34%
jan 1, 2011
44.357 bln
+9.482 bln
27.19%
jan 1, 2012
51.153 bln
+6.795 bln
15.32%
jan 1, 2013
50.851 bln
-301.273 mln
-0.59%
jan 1, 2014
54.943 bln
+4.092 bln
8.05%
jan 1, 2015
55.981 bln
+1.038 bln
1.89%
Ranking of countries by current statistics by years


Comments: