29
/
en
AIzaSyAYiBZKx7MnpbEhh9jyipgxe19OcubqV5w
April 1, 2024
27243
East Asia & Pacific
EAS
false
2
1
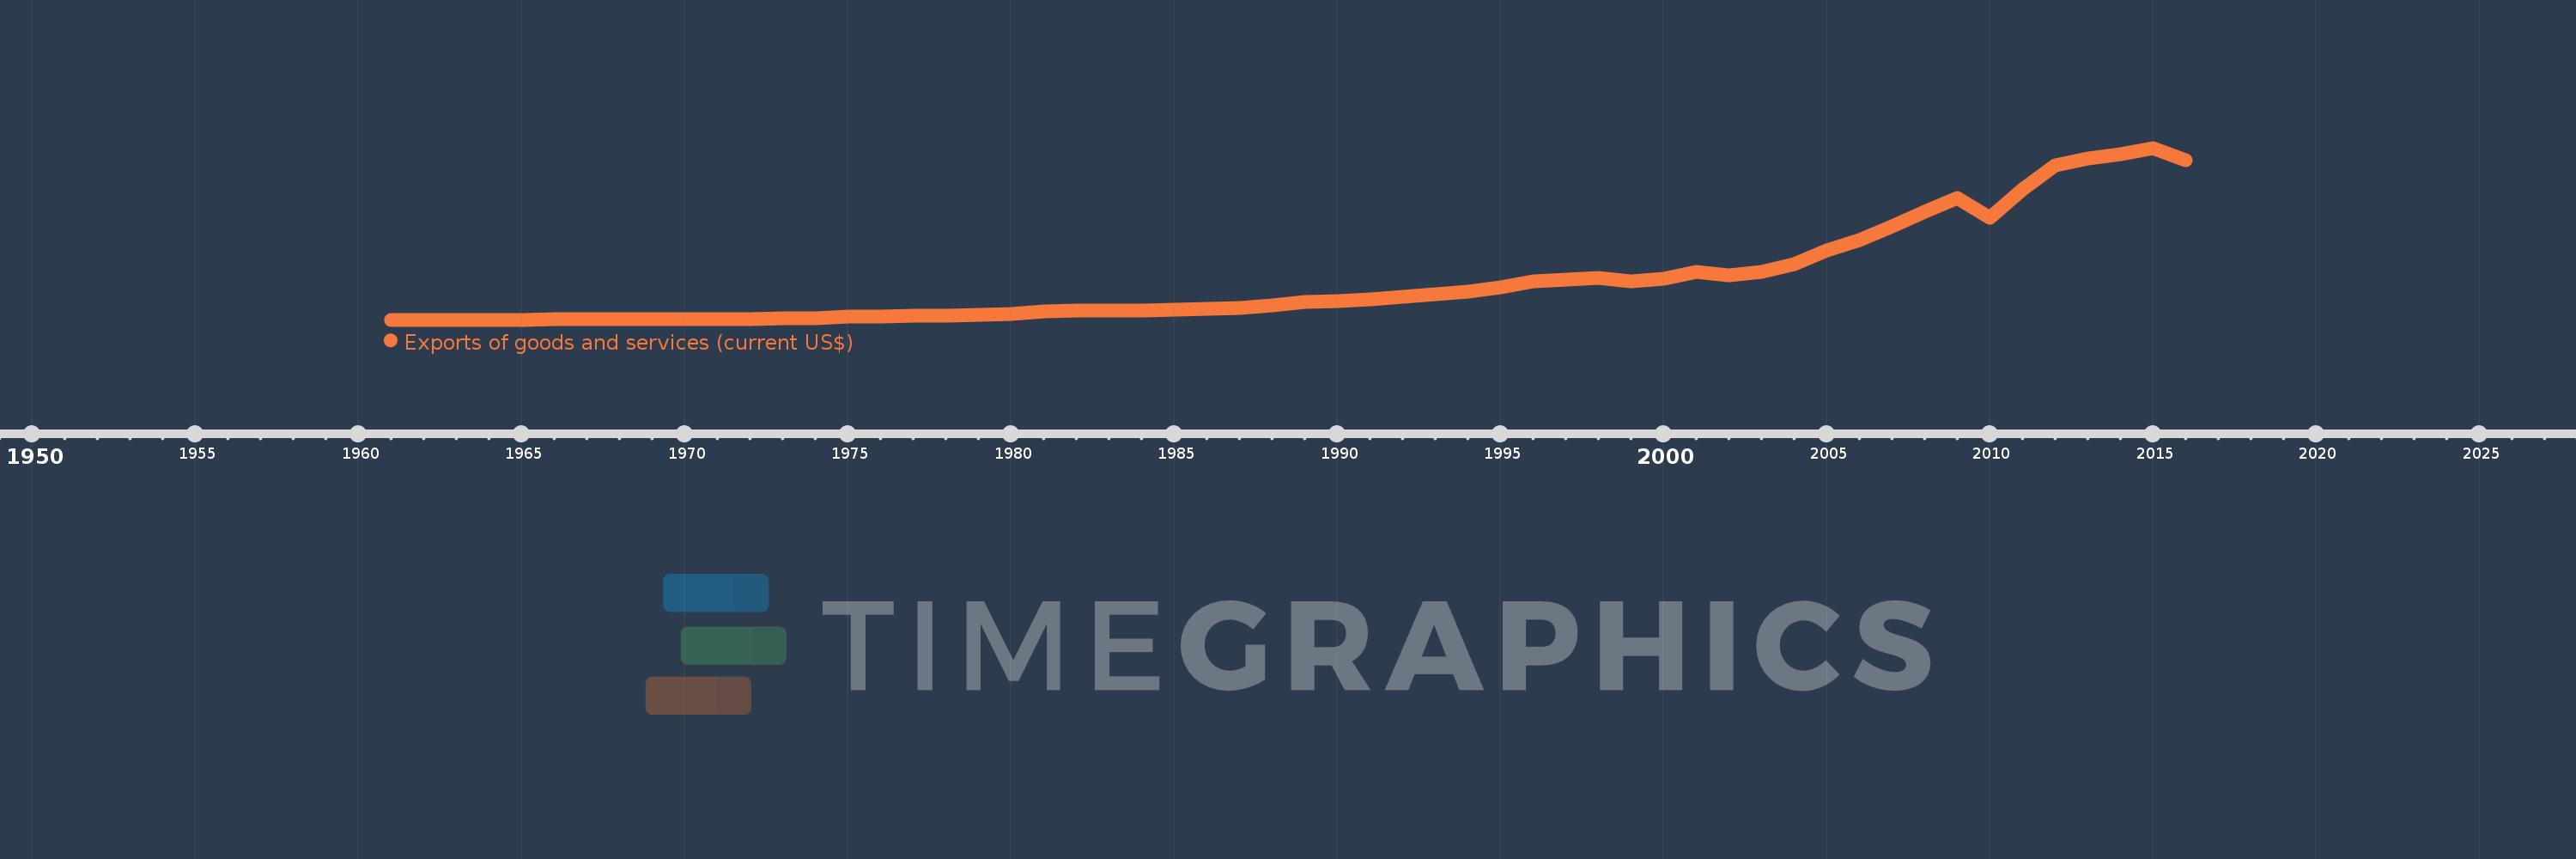
Exports of goods and services (current US$)
2016,2015,2014,2013,2012,2011,2010,2009,2008,2007,2006,2005,2004,2003,2002,2001,2000,1999,1998,1997,1996,1995,1994,1993,1992,1991,1990,1989,1988,1987,1986,1985,1984,1983,1982,1981,1980,1979,1978,1977,1976,1975,1974,1973,1972,1971,1970,1969,1968,1967,1966,1965,1964,1963,1962,1961
This statistics in other country:
AfghanistanAlbaniaAlgeriaAngolaAntigua and BarbudaArab WorldArgentinaArmeniaArubaAustraliaAustriaAzerbaijanBahamas, TheBahrainBangladeshBarbadosBelarusBelgiumBelizeBeninBermudaBhutanBoliviaBosnia and HerzegovinaBotswanaBrazilBrunei DarussalamBulgariaBurkina FasoBurundiCabo VerdeCambodiaCameroonCanadaCaribbean small statesCentral African RepublicCentral Europe and the BalticsChadChileChinaColombiaComorosCongo, Dem. Rep.Congo, Rep.Costa RicaCote d'IvoireCroatiaCubaCyprusCzech RepublicDenmarkDjiboutiDominicaDominican RepublicEarly-demographic dividendEast Asia & PacificEast Asia & Pacific (excluding high income)East Asia & Pacific (IDA & IBRD countries)EcuadorEgypt, Arab Rep.El SalvadorEquatorial GuineaEritreaEstoniaEthiopiaEuro areaEurope & Central AsiaEurope & Central Asia (excluding high income)Europe & Central Asia (IDA & IBRD countries)European UnionFaroe IslandsFijiFinlandFragile and conflict affected situationsFranceFrench PolynesiaGabonGambia, TheGeorgiaGermanyGhanaGreeceGrenadaGuatemalaGuineaGuinea-BissauGuyanaHaitiHeavily indebted poor countries (HIPC)High incomeHondurasHong Kong SAR, ChinaHungaryIBRD onlyIcelandIDA & IBRD totalIDA blendIDA onlyIDA totalIndiaIndonesiaIran, Islamic Rep.IraqIrelandIsraelItalyJamaicaJapanJordanKazakhstanKenyaKiribatiKorea, Rep.KosovoKuwaitKyrgyz RepublicLao PDRLate-demographic dividendLatin America & Caribbean Latin America & Caribbean (excluding high income)Latin America & the Caribbean (IDA & IBRD countries)LatviaLeast developed countries: UN classificationLebanonLesothoLiberiaLibyaLithuaniaLow & middle incomeLow incomeLower middle incomeLuxembourgMacao SAR, ChinaMacedonia, FYRMadagascarMalawiMalaysiaMaldivesMaliMaltaMauritaniaMauritiusMexicoMicronesia, Fed. Sts.Middle East & North AfricaMiddle East & North Africa (excluding high income)Middle East & North Africa (IDA & IBRD countries)Middle incomeMoldovaMongoliaMontenegroMoroccoMozambiqueMyanmarNamibiaNepalNetherlandsNew CaledoniaNew ZealandNicaraguaNigerNigeriaNorth AmericaNorwayOECD membersOmanOther small statesPacific island small statesPakistanPalauPanamaPapua New GuineaParaguayPeruPhilippinesPolandPortugalPost-demographic dividendPre-demographic dividendPuerto RicoQatarRomaniaRussian FederationRwandaSamoaSaudi ArabiaSenegalSerbiaSeychellesSierra LeoneSingaporeSlovak RepublicSloveniaSmall statesSolomon IslandsSomaliaSouth AfricaSouth AsiaSouth Asia (IDA & IBRD)South SudanSpainSri LankaSt. Kitts and NevisSt. LuciaSt. Vincent and the GrenadinesSub-Saharan Africa Sub-Saharan Africa (excluding high income)Sub-Saharan Africa (IDA & IBRD countries)SudanSurinameSwazilandSwedenSwitzerlandSyrian Arab RepublicTajikistanTanzaniaThailandTimor-LesteTogoTongaTrinidad and TobagoTunisiaTurkeyTurkmenistanUgandaUkraineUnited Arab EmiratesUnited KingdomUnited StatesUpper middle incomeUruguayUzbekistanVanuatuVenezuela, RBVietnamWest Bank and GazaWorldYemen, Rep.ZambiaZimbabwe Timeline:
This timeline shows a graph from 1961 to 2016 of East Asia & Pacific. No data until 1960. Number of actual observations by date: 56.
Source name:
World Development Indicators
Source organization:
World Bank national accounts data, and OECD National Accounts data files.
Categories, topics:
Economy & Growth, Trade
Last updated:
apr 23, 2017
Indicators value changes by year
Minimum:
15.729 bln
jan 1, 1962
Maximum:
7.105 trl
jan 1, 2015
At the date of observation
Value
Absolute change
Change from previous value
jan 1, 1961
16.191 bln
+16.191 bln
0.0%
jan 1, 1962
15.729 bln
-462.88 mln
-2.86%
jan 1, 1963
16.93 bln
+1.202 bln
7.64%
jan 1, 1964
18.366 bln
+1.436 bln
8.48%
jan 1, 1965
21.298 bln
+2.932 bln
15.97%
jan 1, 1966
24.122 bln
+2.824 bln
13.26%
jan 1, 1967
27.143 bln
+3.021 bln
12.52%
jan 1, 1968
28.852 bln
+1.71 bln
6.3%
jan 1, 1969
33.456 bln
+4.604 bln
15.96%
jan 1, 1970
39.285 bln
+5.829 bln
17.42%
jan 1, 1971
46.491 bln
+7.206 bln
18.34%
jan 1, 1972
54.741 bln
+8.25 bln
17.75%
jan 1, 1973
66.409 bln
+11.668 bln
21.31%
jan 1, 1974
93.198 bln
+26.789 bln
40.34%
jan 1, 1975
133.691 bln
+40.493 bln
43.45%
jan 1, 1976
137.275 bln
+3.584 bln
2.68%
jan 1, 1977
165.176 bln
+27.901 bln
20.32%
jan 1, 1978
194.448 bln
+29.272 bln
17.72%
jan 1, 1979
227.164 bln
+32.716 bln
16.82%
jan 1, 1980
270.829 bln
+43.665 bln
19.22%
jan 1, 1981
344.513 bln
+73.684 bln
27.21%
jan 1, 1982
390.575 bln
+46.062 bln
13.37%
jan 1, 1983
381.956 bln
-8.62 bln
-2.21%
jan 1, 1984
393.23 bln
+11.275 bln
2.95%
jan 1, 1985
444.556 bln
+51.326 bln
13.05%
jan 1, 1986
448.878 bln
+4.323 bln
0.97%
jan 1, 1987
504.244 bln
+55.366 bln
12.33%
jan 1, 1988
606.073 bln
+101.829 bln
20.19%
jan 1, 1989
735.356 bln
+129.283 bln
21.33%
jan 1, 1990
798.769 bln
+63.413 bln
8.62%
jan 1, 1991
858.132 bln
+59.362 bln
7.43%
jan 1, 1992
970.585 bln
+112.453 bln
13.1%
jan 1, 1993
1.078 trl
+107.014 bln
11.03%
jan 1, 1994
1.182 trl
+104.362 bln
9.68%
jan 1, 1995
1.357 trl
+175.092 bln
14.81%
jan 1, 1996
1.605 trl
+247.598 bln
18.25%
jan 1, 1997
1.675 trl
+69.87 bln
4.35%
jan 1, 1998
1.748 trl
+73.341 bln
4.38%
jan 1, 1999
1.612 trl
-135.5 bln
-7.75%
jan 1, 2000
1.709 trl
+96.753 bln
6.0%
jan 1, 2001
2.005 trl
+295.608 bln
17.3%
jan 1, 2002
1.848 trl
-156.837 bln
-7.82%
jan 1, 2003
1.982 trl
+134.593 bln
7.28%
jan 1, 2004
2.32 trl
+337.845 bln
17.04%
jan 1, 2005
2.878 trl
+557.203 bln
24.01%
jan 1, 2006
3.307 trl
+429.81 bln
14.94%
jan 1, 2007
3.859 trl
+551.328 bln
16.67%
jan 1, 2008
4.48 trl
+621.717 bln
16.11%
jan 1, 2009
5.054 trl
+574.043 bln
12.81%
jan 1, 2010
4.235 trl
-819.82 bln
-16.22%
jan 1, 2011
5.381 trl
+1.146 trl
27.07%
jan 1, 2012
6.394 trl
+1.013 trl
18.83%
jan 1, 2013
6.674 trl
+279.855 bln
4.38%
jan 1, 2014
6.854 trl
+180.024 bln
2.7%
jan 1, 2015
7.105 trl
+250.363 bln
3.65%
jan 1, 2016
6.613 trl
-491.091 bln
-6.91%
Ranking of countries by current statistics by years


Comments: