29
/
en
AIzaSyAYiBZKx7MnpbEhh9jyipgxe19OcubqV5w
April 1, 2024
39870
IDA total
IDA
false
2
1
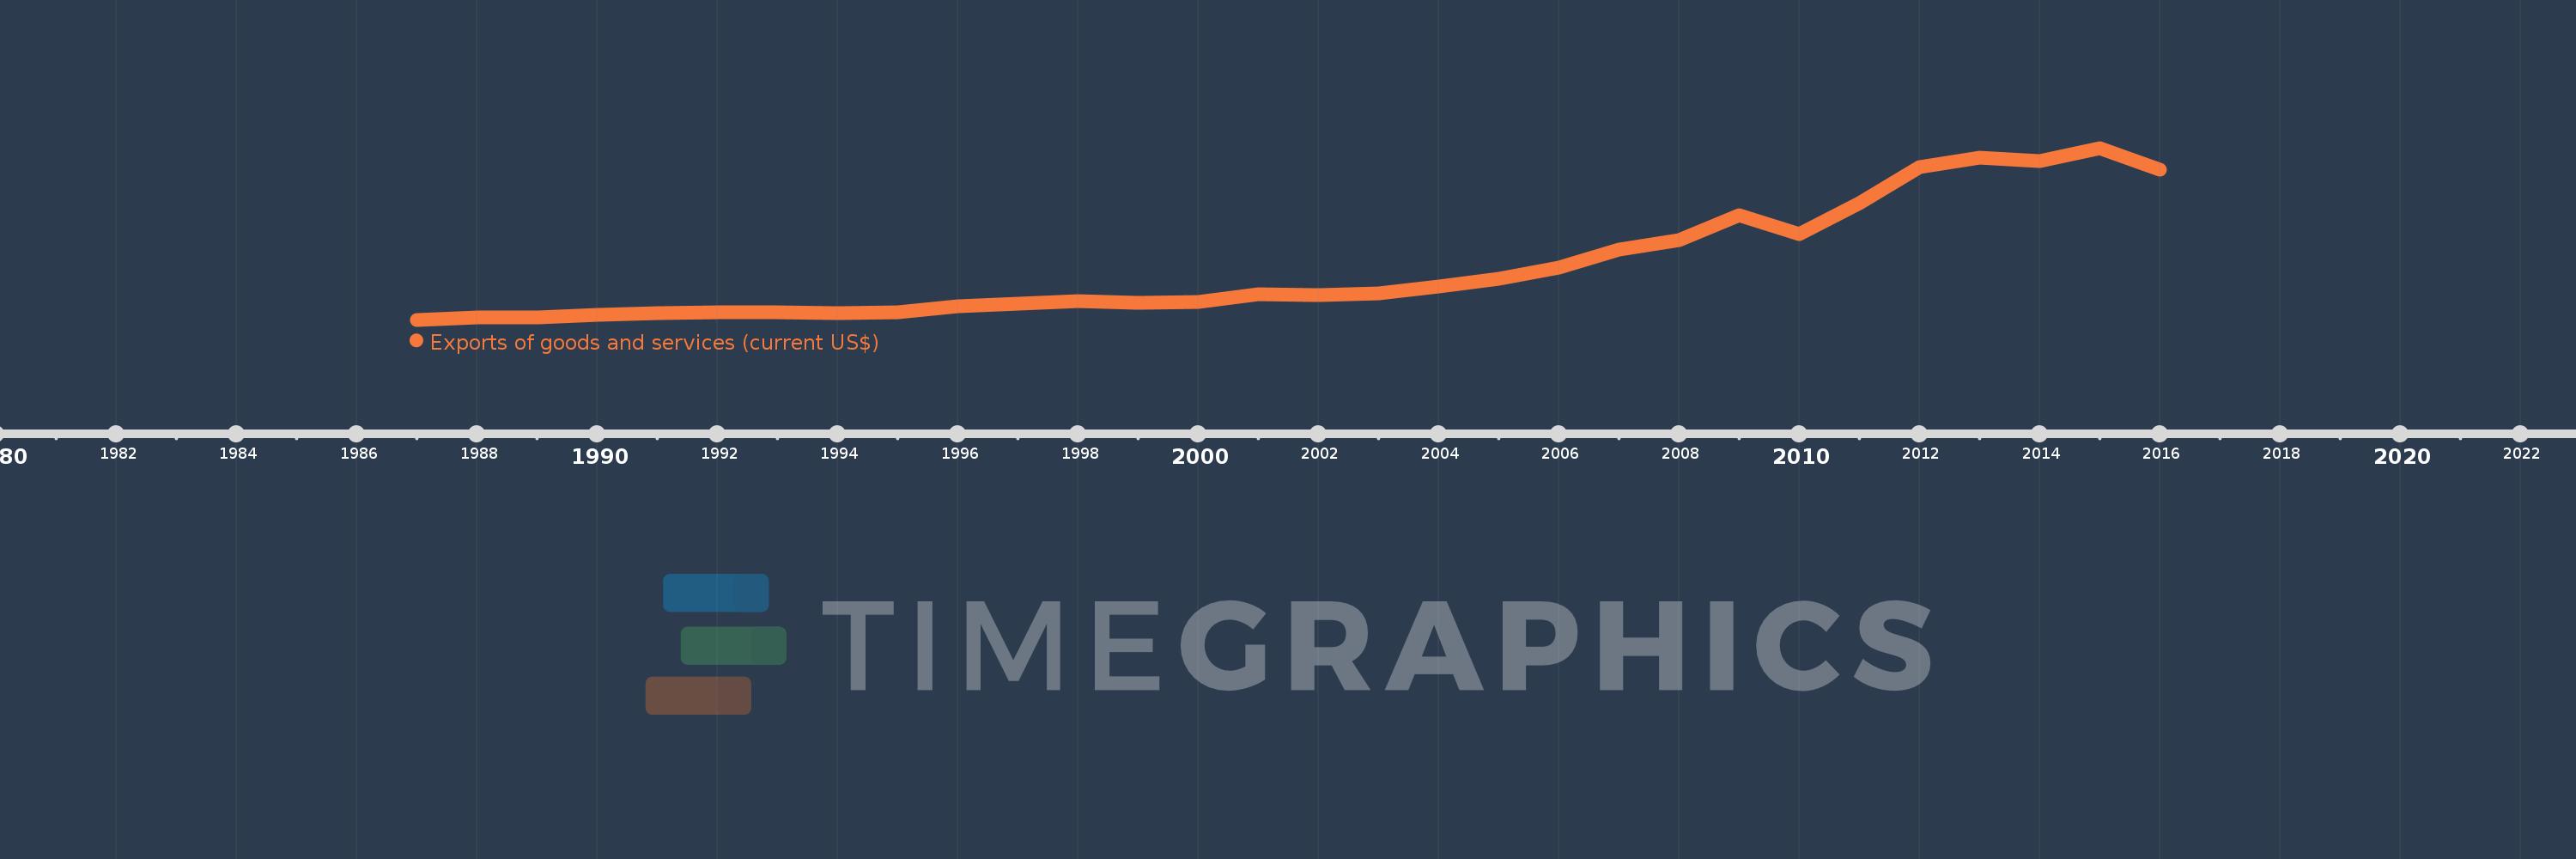
Exports of goods and services (current US$)
2016,2015,2014,2013,2012,2011,2010,2009,2008,2007,2006,2005,2004,2003,2002,2001,2000,1999,1998,1997,1996,1995,1994,1993,1992,1991,1990,1989,1988,1987
This statistics in other country:
AfghanistanAlbaniaAlgeriaAngolaAntigua and BarbudaArab WorldArgentinaArmeniaArubaAustraliaAustriaAzerbaijanBahamas, TheBahrainBangladeshBarbadosBelarusBelgiumBelizeBeninBermudaBhutanBoliviaBosnia and HerzegovinaBotswanaBrazilBrunei DarussalamBulgariaBurkina FasoBurundiCabo VerdeCambodiaCameroonCanadaCaribbean small statesCentral African RepublicCentral Europe and the BalticsChadChileChinaColombiaComorosCongo, Dem. Rep.Congo, Rep.Costa RicaCote d'IvoireCroatiaCubaCyprusCzech RepublicDenmarkDjiboutiDominicaDominican RepublicEarly-demographic dividendEast Asia & PacificEast Asia & Pacific (excluding high income)East Asia & Pacific (IDA & IBRD countries)EcuadorEgypt, Arab Rep.El SalvadorEquatorial GuineaEritreaEstoniaEthiopiaEuro areaEurope & Central AsiaEurope & Central Asia (excluding high income)Europe & Central Asia (IDA & IBRD countries)European UnionFaroe IslandsFijiFinlandFragile and conflict affected situationsFranceFrench PolynesiaGabonGambia, TheGeorgiaGermanyGhanaGreeceGrenadaGuatemalaGuineaGuinea-BissauGuyanaHaitiHeavily indebted poor countries (HIPC)High incomeHondurasHong Kong SAR, ChinaHungaryIBRD onlyIcelandIDA & IBRD totalIDA blendIDA onlyIDA totalIndiaIndonesiaIran, Islamic Rep.IraqIrelandIsraelItalyJamaicaJapanJordanKazakhstanKenyaKiribatiKorea, Rep.KosovoKuwaitKyrgyz RepublicLao PDRLate-demographic dividendLatin America & Caribbean Latin America & Caribbean (excluding high income)Latin America & the Caribbean (IDA & IBRD countries)LatviaLeast developed countries: UN classificationLebanonLesothoLiberiaLibyaLithuaniaLow & middle incomeLow incomeLower middle incomeLuxembourgMacao SAR, ChinaMacedonia, FYRMadagascarMalawiMalaysiaMaldivesMaliMaltaMauritaniaMauritiusMexicoMicronesia, Fed. Sts.Middle East & North AfricaMiddle East & North Africa (excluding high income)Middle East & North Africa (IDA & IBRD countries)Middle incomeMoldovaMongoliaMontenegroMoroccoMozambiqueMyanmarNamibiaNepalNetherlandsNew CaledoniaNew ZealandNicaraguaNigerNigeriaNorth AmericaNorwayOECD membersOmanOther small statesPacific island small statesPakistanPalauPanamaPapua New GuineaParaguayPeruPhilippinesPolandPortugalPost-demographic dividendPre-demographic dividendPuerto RicoQatarRomaniaRussian FederationRwandaSamoaSaudi ArabiaSenegalSerbiaSeychellesSierra LeoneSingaporeSlovak RepublicSloveniaSmall statesSolomon IslandsSomaliaSouth AfricaSouth AsiaSouth Asia (IDA & IBRD)South SudanSpainSri LankaSt. Kitts and NevisSt. LuciaSt. Vincent and the GrenadinesSub-Saharan Africa Sub-Saharan Africa (excluding high income)Sub-Saharan Africa (IDA & IBRD countries)SudanSurinameSwazilandSwedenSwitzerlandSyrian Arab RepublicTajikistanTanzaniaThailandTimor-LesteTogoTongaTrinidad and TobagoTunisiaTurkeyTurkmenistanUgandaUkraineUnited Arab EmiratesUnited KingdomUnited StatesUpper middle incomeUruguayUzbekistanVanuatuVenezuela, RBVietnamWest Bank and GazaWorldYemen, Rep.ZambiaZimbabwe Timeline:
This timeline shows a graph from 1987 to 2016 of IDA total. No data until 1986. Number of actual observations by date: 30.
Source name:
World Development Indicators
Source organization:
World Bank national accounts data, and OECD National Accounts data files.
Categories, topics:
Economy & Growth, Trade
Last updated:
apr 23, 2017
Indicators value changes by year
Minimum:
43.914 bln
jan 1, 1987
Maximum:
642.316 bln
jan 1, 2015
At the date of observation
Value
Absolute change
Change from previous value
jan 1, 1987
43.914 bln
+43.914 bln
0.0%
jan 1, 1988
51.678 bln
+7.764 bln
17.68%
jan 1, 1989
50.565 bln
-1.113 bln
-2.15%
jan 1, 1990
60.013 bln
+9.448 bln
18.68%
jan 1, 1991
65.817 bln
+5.804 bln
9.67%
jan 1, 1992
71.289 bln
+5.472 bln
8.31%
jan 1, 1993
70.832 bln
-456.686 mln
-0.64%
jan 1, 1994
68.007 bln
-2.825 bln
-3.99%
jan 1, 1995
69.902 bln
+1.895 bln
2.79%
jan 1, 1996
91.592 bln
+21.69 bln
31.03%
jan 1, 1997
101.278 bln
+9.686 bln
10.58%
jan 1, 1998
108.274 bln
+6.996 bln
6.91%
jan 1, 1999
101.964 bln
-6.31 bln
-5.83%
jan 1, 2000
107.062 bln
+5.099 bln
5.0%
jan 1, 2001
132.201 bln
+25.139 bln
23.48%
jan 1, 2002
129.514 bln
-2.687 bln
-2.03%
jan 1, 2003
136.711 bln
+7.197 bln
5.56%
jan 1, 2004
159.462 bln
+22.751 bln
16.64%
jan 1, 2005
185.965 bln
+26.503 bln
16.62%
jan 1, 2006
225.951 bln
+39.987 bln
21.5%
jan 1, 2007
288.518 bln
+62.567 bln
27.69%
jan 1, 2008
322.478 bln
+33.96 bln
11.77%
jan 1, 2009
407.117 bln
+84.639 bln
26.25%
jan 1, 2010
341.905 bln
-65.212 bln
-16.02%
jan 1, 2011
450.436 bln
+108.532 bln
31.74%
jan 1, 2012
574.41 bln
+123.974 bln
27.52%
jan 1, 2013
608.151 bln
+33.741 bln
5.87%
jan 1, 2014
595.194 bln
-12.956 bln
-2.13%
jan 1, 2015
642.316 bln
+47.122 bln
7.92%
jan 1, 2016
567.425 bln
-74.891 bln
-11.66%
Ranking of countries by current statistics by years


Comments: