29
/
en
AIzaSyAYiBZKx7MnpbEhh9jyipgxe19OcubqV5w
April 1, 2024
206684
Nepal
NPL
true
2
1
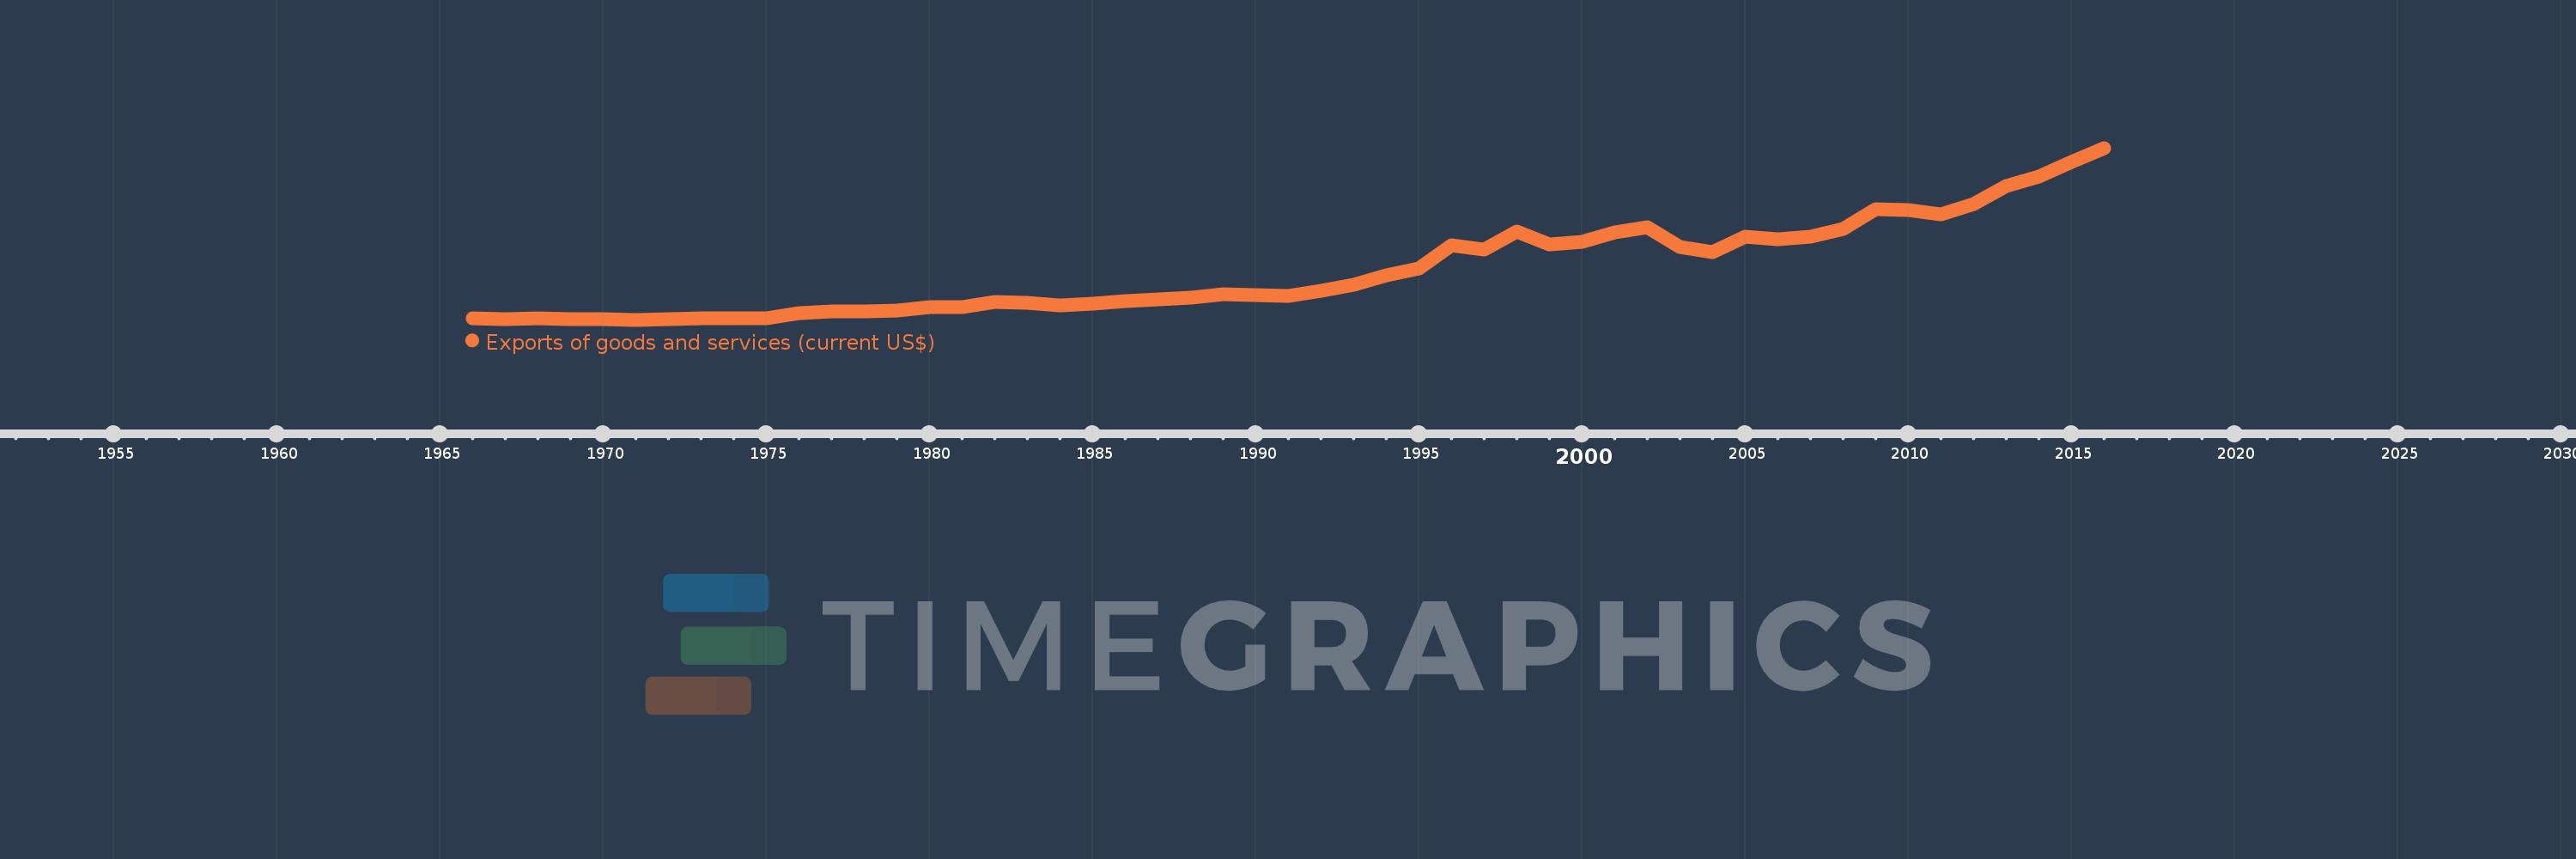
Exports of goods and services (current US$)
2016,2015,2014,2013,2012,2011,2010,2009,2008,2007,2006,2005,2004,2003,2002,2001,2000,1999,1998,1997,1996,1995,1994,1993,1992,1991,1990,1989,1988,1987,1986,1985,1984,1983,1982,1981,1980,1979,1978,1977,1976,1975,1974,1973,1972,1971,1970,1969,1968,1967,1966
This statistics in other country:
AfghanistanAlbaniaAlgeriaAngolaAntigua and BarbudaArab WorldArgentinaArmeniaArubaAustraliaAustriaAzerbaijanBahamas, TheBahrainBangladeshBarbadosBelarusBelgiumBelizeBeninBermudaBhutanBoliviaBosnia and HerzegovinaBotswanaBrazilBrunei DarussalamBulgariaBurkina FasoBurundiCabo VerdeCambodiaCameroonCanadaCaribbean small statesCentral African RepublicCentral Europe and the BalticsChadChileChinaColombiaComorosCongo, Dem. Rep.Congo, Rep.Costa RicaCote d'IvoireCroatiaCubaCyprusCzech RepublicDenmarkDjiboutiDominicaDominican RepublicEarly-demographic dividendEast Asia & PacificEast Asia & Pacific (excluding high income)East Asia & Pacific (IDA & IBRD countries)EcuadorEgypt, Arab Rep.El SalvadorEquatorial GuineaEritreaEstoniaEthiopiaEuro areaEurope & Central AsiaEurope & Central Asia (excluding high income)Europe & Central Asia (IDA & IBRD countries)European UnionFaroe IslandsFijiFinlandFragile and conflict affected situationsFranceFrench PolynesiaGabonGambia, TheGeorgiaGermanyGhanaGreeceGrenadaGuatemalaGuineaGuinea-BissauGuyanaHaitiHeavily indebted poor countries (HIPC)High incomeHondurasHong Kong SAR, ChinaHungaryIBRD onlyIcelandIDA & IBRD totalIDA blendIDA onlyIDA totalIndiaIndonesiaIran, Islamic Rep.IraqIrelandIsraelItalyJamaicaJapanJordanKazakhstanKenyaKiribatiKorea, Rep.KosovoKuwaitKyrgyz RepublicLao PDRLate-demographic dividendLatin America & Caribbean Latin America & Caribbean (excluding high income)Latin America & the Caribbean (IDA & IBRD countries)LatviaLeast developed countries: UN classificationLebanonLesothoLiberiaLibyaLithuaniaLow & middle incomeLow incomeLower middle incomeLuxembourgMacao SAR, ChinaMacedonia, FYRMadagascarMalawiMalaysiaMaldivesMaliMaltaMauritaniaMauritiusMexicoMicronesia, Fed. Sts.Middle East & North AfricaMiddle East & North Africa (excluding high income)Middle East & North Africa (IDA & IBRD countries)Middle incomeMoldovaMongoliaMontenegroMoroccoMozambiqueMyanmarNamibiaNepalNetherlandsNew CaledoniaNew ZealandNicaraguaNigerNigeriaNorth AmericaNorwayOECD membersOmanOther small statesPacific island small statesPakistanPalauPanamaPapua New GuineaParaguayPeruPhilippinesPolandPortugalPost-demographic dividendPre-demographic dividendPuerto RicoQatarRomaniaRussian FederationRwandaSamoaSaudi ArabiaSenegalSerbiaSeychellesSierra LeoneSingaporeSlovak RepublicSloveniaSmall statesSolomon IslandsSomaliaSouth AfricaSouth AsiaSouth Asia (IDA & IBRD)South SudanSpainSri LankaSt. Kitts and NevisSt. LuciaSt. Vincent and the GrenadinesSub-Saharan Africa Sub-Saharan Africa (excluding high income)Sub-Saharan Africa (IDA & IBRD countries)SudanSurinameSwazilandSwedenSwitzerlandSyrian Arab RepublicTajikistanTanzaniaThailandTimor-LesteTogoTongaTrinidad and TobagoTunisiaTurkeyTurkmenistanUgandaUkraineUnited Arab EmiratesUnited KingdomUnited StatesUpper middle incomeUruguayUzbekistanVanuatuVenezuela, RBVietnamWest Bank and GazaWorldYemen, Rep.ZambiaZimbabwe Timeline:
This timeline shows a graph from 1966 to 2016 of Nepal. No data until 1965. Number of actual observations by date: 51.
Source name:
World Development Indicators
Source organization:
World Bank national accounts data, and OECD National Accounts data files.
Categories, topics:
Economy & Growth, Trade
Last updated:
apr 23, 2017
Indicators value changes by year
Minimum:
42.469 mln
jan 1, 1971
Maximum:
2.475 bln
jan 1, 2016
At the date of observation
Value
Absolute change
Change from previous value
jan 1, 1966
57.094 mln
+57.094 mln
0.0%
jan 1, 1967
51.188 mln
-5.906 mln
-10.34%
jan 1, 1968
57.882 mln
+6.694 mln
13.08%
jan 1, 1969
52.86 mln
-5.022 mln
-8.68%
jan 1, 1970
55.309 mln
+2.449 mln
4.63%
jan 1, 1971
42.469 mln
-12.84 mln
-23.21%
jan 1, 1972
47.704 mln
+5.235 mln
12.33%
jan 1, 1973
57.975 mln
+10.272 mln
21.53%
jan 1, 1974
64.261 mln
+6.285 mln
10.84%
jan 1, 1975
66.375 mln
+2.114 mln
3.29%
jan 1, 1976
140.262 mln
+73.887 mln
111.32%
jan 1, 1977
156.521 mln
+16.259 mln
11.59%
jan 1, 1978
162.96 mln
+6.439 mln
4.11%
jan 1, 1979
169.587 mln
+6.627 mln
4.07%
jan 1, 1980
218.167 mln
+48.58 mln
28.65%
jan 1, 1981
224.583 mln
+6.417 mln
2.94%
jan 1, 1982
293.583 mln
+69.0 mln
30.72%
jan 1, 1983
277.668 mln
-15.915 mln
-5.42%
jan 1, 1984
250.372 mln
-27.297 mln
-9.83%
jan 1, 1985
274.962 mln
+24.59 mln
9.82%
jan 1, 1986
302.055 mln
+27.094 mln
9.85%
jan 1, 1987
332.467 mln
+30.412 mln
10.07%
jan 1, 1988
349.349 mln
+16.882 mln
5.08%
jan 1, 1989
399.164 mln
+49.815 mln
14.26%
jan 1, 1990
390.158 mln
-9.006 mln
-2.26%
jan 1, 1991
381.885 mln
-8.274 mln
-2.12%
jan 1, 1992
450.607 mln
+68.722 mln
18.0%
jan 1, 1993
542.824 mln
+92.217 mln
20.47%
jan 1, 1994
674.654 mln
+131.83 mln
24.29%
jan 1, 1995
772.441 mln
+97.787 mln
14.49%
jan 1, 1996
1.099 bln
+326.654 mln
42.29%
jan 1, 1997
1.032 bln
-67.38 mln
-6.13%
jan 1, 1998
1.295 bln
+263.27 mln
25.52%
jan 1, 1999
1.108 bln
-186.688 mln
-14.42%
jan 1, 2000
1.15 bln
+41.813 mln
3.77%
jan 1, 2001
1.279 bln
+129.172 mln
11.23%
jan 1, 2002
1.355 bln
+75.956 mln
5.94%
jan 1, 2003
1.073 bln
-281.986 mln
-20.81%
jan 1, 2004
993.876 mln
-79.376 mln
-7.4%
jan 1, 2005
1.213 bln
+219.613 mln
22.1%
jan 1, 2006
1.186 bln
-27.798 mln
-2.29%
jan 1, 2007
1.216 bln
+30.38 mln
2.56%
jan 1, 2008
1.327 bln
+111.355 mln
9.16%
jan 1, 2009
1.603 bln
+275.356 mln
20.74%
jan 1, 2010
1.597 bln
-6.277 mln
-0.39%
jan 1, 2011
1.533 bln
-63.046 mln
-3.95%
jan 1, 2012
1.678 bln
+144.965 mln
9.45%
jan 1, 2013
1.935 bln
+256.431 mln
15.28%
jan 1, 2014
2.073 bln
+138.135 mln
7.14%
jan 1, 2015
2.279 bln
+206.395 mln
9.96%
jan 1, 2016
2.475 bln
+195.116 mln
8.56%
Ranking of countries by current statistics by years


Comments: