29
/
en
AIzaSyAYiBZKx7MnpbEhh9jyipgxe19OcubqV5w
April 1, 2024
146780
Guinea-Bissau
GNB
true
2
1
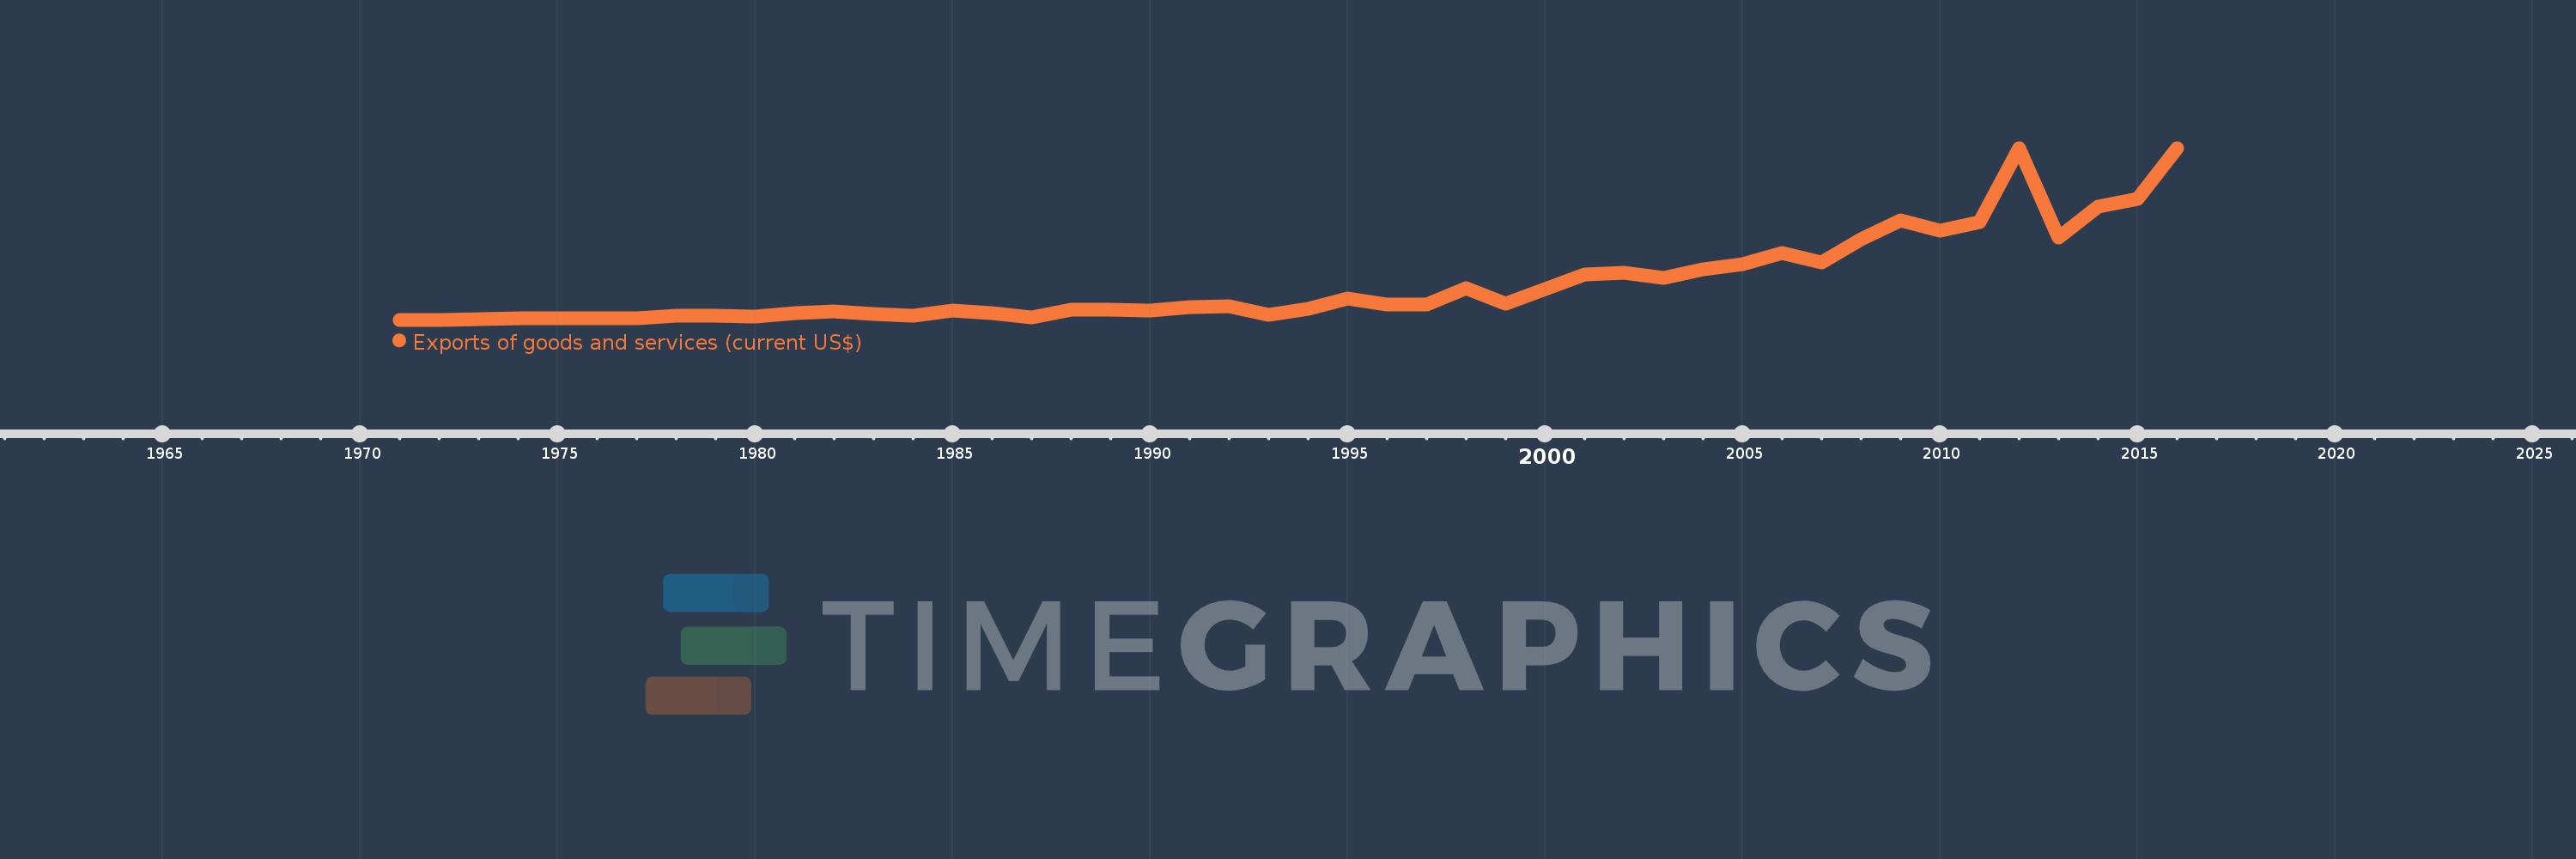
Exports of goods and services (current US$)
2016,2015,2014,2013,2012,2011,2010,2009,2008,2007,2006,2005,2004,2003,2002,2001,2000,1999,1998,1997,1996,1995,1994,1993,1992,1991,1990,1989,1988,1987,1986,1985,1984,1983,1982,1981,1980,1979,1978,1977,1976,1975,1974,1973,1972,1971
This statistics in other country:
AfghanistanAlbaniaAlgeriaAngolaAntigua and BarbudaArab WorldArgentinaArmeniaArubaAustraliaAustriaAzerbaijanBahamas, TheBahrainBangladeshBarbadosBelarusBelgiumBelizeBeninBermudaBhutanBoliviaBosnia and HerzegovinaBotswanaBrazilBrunei DarussalamBulgariaBurkina FasoBurundiCabo VerdeCambodiaCameroonCanadaCaribbean small statesCentral African RepublicCentral Europe and the BalticsChadChileChinaColombiaComorosCongo, Dem. Rep.Congo, Rep.Costa RicaCote d'IvoireCroatiaCubaCyprusCzech RepublicDenmarkDjiboutiDominicaDominican RepublicEarly-demographic dividendEast Asia & PacificEast Asia & Pacific (excluding high income)East Asia & Pacific (IDA & IBRD countries)EcuadorEgypt, Arab Rep.El SalvadorEquatorial GuineaEritreaEstoniaEthiopiaEuro areaEurope & Central AsiaEurope & Central Asia (excluding high income)Europe & Central Asia (IDA & IBRD countries)European UnionFaroe IslandsFijiFinlandFragile and conflict affected situationsFranceFrench PolynesiaGabonGambia, TheGeorgiaGermanyGhanaGreeceGrenadaGuatemalaGuineaGuinea-BissauGuyanaHaitiHeavily indebted poor countries (HIPC)High incomeHondurasHong Kong SAR, ChinaHungaryIBRD onlyIcelandIDA & IBRD totalIDA blendIDA onlyIDA totalIndiaIndonesiaIran, Islamic Rep.IraqIrelandIsraelItalyJamaicaJapanJordanKazakhstanKenyaKiribatiKorea, Rep.KosovoKuwaitKyrgyz RepublicLao PDRLate-demographic dividendLatin America & Caribbean Latin America & Caribbean (excluding high income)Latin America & the Caribbean (IDA & IBRD countries)LatviaLeast developed countries: UN classificationLebanonLesothoLiberiaLibyaLithuaniaLow & middle incomeLow incomeLower middle incomeLuxembourgMacao SAR, ChinaMacedonia, FYRMadagascarMalawiMalaysiaMaldivesMaliMaltaMauritaniaMauritiusMexicoMicronesia, Fed. Sts.Middle East & North AfricaMiddle East & North Africa (excluding high income)Middle East & North Africa (IDA & IBRD countries)Middle incomeMoldovaMongoliaMontenegroMoroccoMozambiqueMyanmarNamibiaNepalNetherlandsNew CaledoniaNew ZealandNicaraguaNigerNigeriaNorth AmericaNorwayOECD membersOmanOther small statesPacific island small statesPakistanPalauPanamaPapua New GuineaParaguayPeruPhilippinesPolandPortugalPost-demographic dividendPre-demographic dividendPuerto RicoQatarRomaniaRussian FederationRwandaSamoaSaudi ArabiaSenegalSerbiaSeychellesSierra LeoneSingaporeSlovak RepublicSloveniaSmall statesSolomon IslandsSomaliaSouth AfricaSouth AsiaSouth Asia (IDA & IBRD)South SudanSpainSri LankaSt. Kitts and NevisSt. LuciaSt. Vincent and the GrenadinesSub-Saharan Africa Sub-Saharan Africa (excluding high income)Sub-Saharan Africa (IDA & IBRD countries)SudanSurinameSwazilandSwedenSwitzerlandSyrian Arab RepublicTajikistanTanzaniaThailandTimor-LesteTogoTongaTrinidad and TobagoTunisiaTurkeyTurkmenistanUgandaUkraineUnited Arab EmiratesUnited KingdomUnited StatesUpper middle incomeUruguayUzbekistanVanuatuVenezuela, RBVietnamWest Bank and GazaWorldYemen, Rep.ZambiaZimbabwe Timeline:
This timeline shows a graph from 1971 to 2016 of Guinea-Bissau. No data until 1970. Number of actual observations by date: 46.
Source name:
World Development Indicators
Source organization:
World Bank national accounts data, and OECD National Accounts data files.
Categories, topics:
Economy & Growth, Trade
Last updated:
apr 23, 2017
Indicators value changes by year
Minimum:
3.149 mln
jan 1, 1971
Maximum:
295.405 mln
jan 1, 2012
At the date of observation
Value
Absolute change
Change from previous value
jan 1, 1971
3.149 mln
+3.149 mln
0.0%
jan 1, 1972
3.266 mln
+116.5K
3.7%
jan 1, 1973
3.82 mln
+554.171K
16.97%
jan 1, 1974
5.416 mln
+1.596 mln
41.78%
jan 1, 1975
4.957 mln
-459.024K
-8.48%
jan 1, 1976
5.651 mln
+693.901K
14.0%
jan 1, 1977
5.926 mln
+274.857K
4.86%
jan 1, 1978
10.697 mln
+4.772 mln
80.52%
jan 1, 1979
9.488 mln
-1.209 mln
-11.31%
jan 1, 1980
8.62 mln
-867.574K
-9.14%
jan 1, 1981
14.039 mln
+5.419 mln
62.86%
jan 1, 1982
17.319 mln
+3.28 mln
23.36%
jan 1, 1983
12.977 mln
-4.342 mln
-25.07%
jan 1, 1984
9.83 mln
-3.148 mln
-24.26%
jan 1, 1985
18.558 mln
+8.728 mln
88.8%
jan 1, 1986
14.037 mln
-4.52 mln
-24.36%
jan 1, 1987
6.818 mln
-7.22 mln
-51.43%
jan 1, 1988
19.76 mln
+12.942 mln
189.84%
jan 1, 1989
20.46 mln
+700.079K
3.54%
jan 1, 1990
18.95 mln
-1.51 mln
-7.38%
jan 1, 1991
24.24 mln
+5.29 mln
27.92%
jan 1, 1992
25.67 mln
+1.43 mln
5.9%
jan 1, 1993
11.095 mln
-14.575 mln
-56.78%
jan 1, 1994
21.01 mln
+9.915 mln
89.36%
jan 1, 1995
38.77 mln
+17.76 mln
84.53%
jan 1, 1996
29.631 mln
-9.139 mln
-23.57%
jan 1, 1997
28.46 mln
-1.171 mln
-3.95%
jan 1, 1998
56.441 mln
+27.981 mln
98.32%
jan 1, 1999
29.82 mln
-26.621 mln
-47.17%
jan 1, 2000
55.8 mln
+25.98 mln
87.12%
jan 1, 2001
80.534 mln
+24.734 mln
44.33%
jan 1, 2002
83.142 mln
+2.607 mln
3.24%
jan 1, 2003
74.158 mln
-8.984 mln
-10.81%
jan 1, 2004
88.988 mln
+14.831 mln
20.0%
jan 1, 2005
98.042 mln
+9.054 mln
10.17%
jan 1, 2006
116.506 mln
+18.463 mln
18.83%
jan 1, 2007
100.786 mln
-15.72 mln
-13.49%
jan 1, 2008
140.354 mln
+39.568 mln
39.26%
jan 1, 2009
171.901 mln
+31.547 mln
22.48%
jan 1, 2010
154.761 mln
-17.14 mln
-9.97%
jan 1, 2011
169.081 mln
+14.32 mln
9.25%
jan 1, 2012
295.405 mln
+126.324 mln
74.71%
jan 1, 2013
142.721 mln
-152.683 mln
-51.69%
jan 1, 2014
196.079 mln
+53.357 mln
37.39%
jan 1, 2015
208.674 mln
+12.595 mln
6.42%
jan 1, 2016
295.207 mln
+86.533 mln
41.47%
Ranking of countries by current statistics by years


Comments: