29
/
en
AIzaSyAYiBZKx7MnpbEhh9jyipgxe19OcubqV5w
April 1, 2024
115752
Cuba
CUB
true
2
1
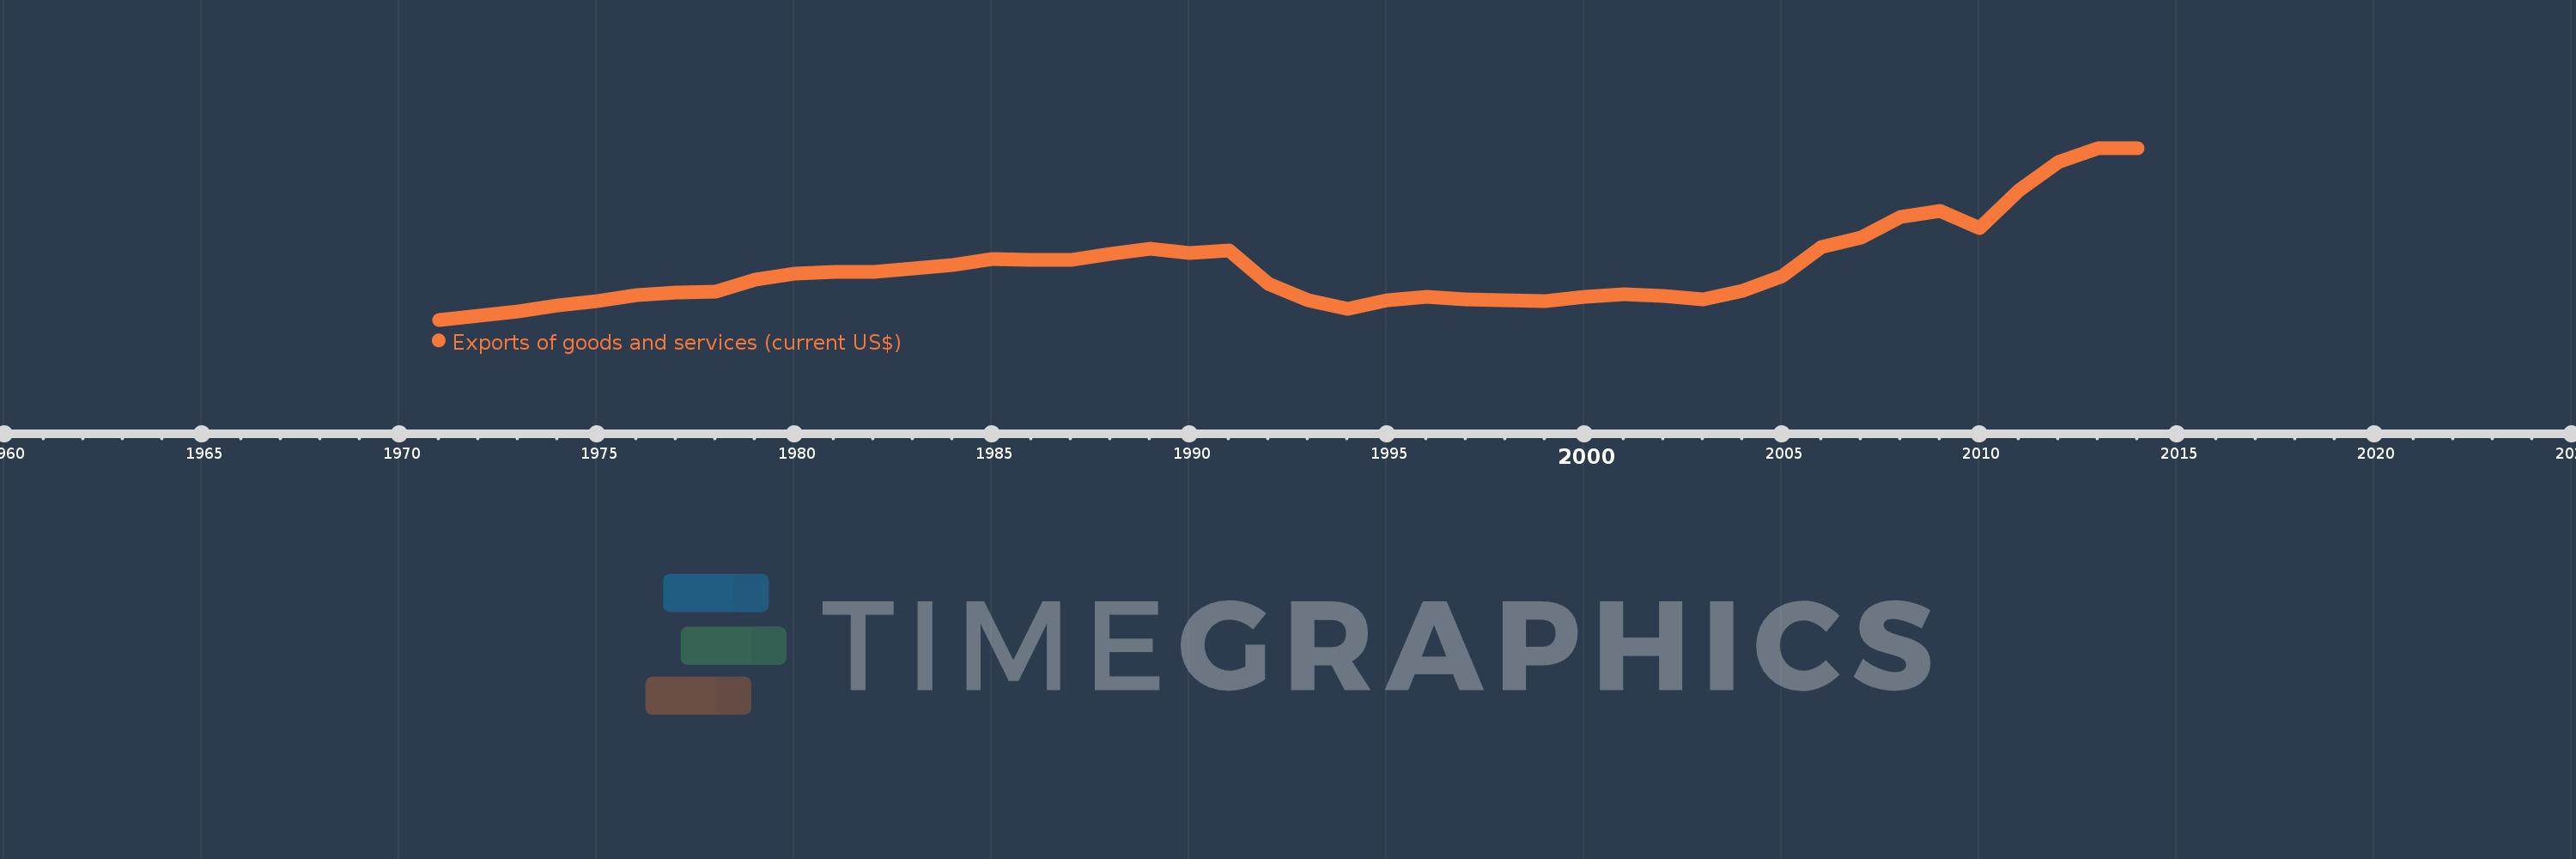
Exports of goods and services (current US$)
2014,2013,2012,2011,2010,2009,2008,2007,2006,2005,2004,2003,2002,2001,2000,1999,1998,1997,1996,1995,1994,1993,1992,1991,1990,1989,1988,1987,1986,1985,1984,1983,1982,1981,1980,1979,1978,1977,1976,1975,1974,1973,1972,1971
This statistics in other country:
AfghanistanAlbaniaAlgeriaAngolaAntigua and BarbudaArab WorldArgentinaArmeniaArubaAustraliaAustriaAzerbaijanBahamas, TheBahrainBangladeshBarbadosBelarusBelgiumBelizeBeninBermudaBhutanBoliviaBosnia and HerzegovinaBotswanaBrazilBrunei DarussalamBulgariaBurkina FasoBurundiCabo VerdeCambodiaCameroonCanadaCaribbean small statesCentral African RepublicCentral Europe and the BalticsChadChileChinaColombiaComorosCongo, Dem. Rep.Congo, Rep.Costa RicaCote d'IvoireCroatiaCubaCyprusCzech RepublicDenmarkDjiboutiDominicaDominican RepublicEarly-demographic dividendEast Asia & PacificEast Asia & Pacific (excluding high income)East Asia & Pacific (IDA & IBRD countries)EcuadorEgypt, Arab Rep.El SalvadorEquatorial GuineaEritreaEstoniaEthiopiaEuro areaEurope & Central AsiaEurope & Central Asia (excluding high income)Europe & Central Asia (IDA & IBRD countries)European UnionFaroe IslandsFijiFinlandFragile and conflict affected situationsFranceFrench PolynesiaGabonGambia, TheGeorgiaGermanyGhanaGreeceGrenadaGuatemalaGuineaGuinea-BissauGuyanaHaitiHeavily indebted poor countries (HIPC)High incomeHondurasHong Kong SAR, ChinaHungaryIBRD onlyIcelandIDA & IBRD totalIDA blendIDA onlyIDA totalIndiaIndonesiaIran, Islamic Rep.IraqIrelandIsraelItalyJamaicaJapanJordanKazakhstanKenyaKiribatiKorea, Rep.KosovoKuwaitKyrgyz RepublicLao PDRLate-demographic dividendLatin America & Caribbean Latin America & Caribbean (excluding high income)Latin America & the Caribbean (IDA & IBRD countries)LatviaLeast developed countries: UN classificationLebanonLesothoLiberiaLibyaLithuaniaLow & middle incomeLow incomeLower middle incomeLuxembourgMacao SAR, ChinaMacedonia, FYRMadagascarMalawiMalaysiaMaldivesMaliMaltaMauritaniaMauritiusMexicoMicronesia, Fed. Sts.Middle East & North AfricaMiddle East & North Africa (excluding high income)Middle East & North Africa (IDA & IBRD countries)Middle incomeMoldovaMongoliaMontenegroMoroccoMozambiqueMyanmarNamibiaNepalNetherlandsNew CaledoniaNew ZealandNicaraguaNigerNigeriaNorth AmericaNorwayOECD membersOmanOther small statesPacific island small statesPakistanPalauPanamaPapua New GuineaParaguayPeruPhilippinesPolandPortugalPost-demographic dividendPre-demographic dividendPuerto RicoQatarRomaniaRussian FederationRwandaSamoaSaudi ArabiaSenegalSerbiaSeychellesSierra LeoneSingaporeSlovak RepublicSloveniaSmall statesSolomon IslandsSomaliaSouth AfricaSouth AsiaSouth Asia (IDA & IBRD)South SudanSpainSri LankaSt. Kitts and NevisSt. LuciaSt. Vincent and the GrenadinesSub-Saharan Africa Sub-Saharan Africa (excluding high income)Sub-Saharan Africa (IDA & IBRD countries)SudanSurinameSwazilandSwedenSwitzerlandSyrian Arab RepublicTajikistanTanzaniaThailandTimor-LesteTogoTongaTrinidad and TobagoTunisiaTurkeyTurkmenistanUgandaUkraineUnited Arab EmiratesUnited KingdomUnited StatesUpper middle incomeUruguayUzbekistanVanuatuVenezuela, RBVietnamWest Bank and GazaWorldYemen, Rep.ZambiaZimbabwe Timeline:
This timeline shows a graph from 1971 to 2014 of Cuba. No data until 1970. Number of actual observations by date: 44.
Source name:
World Development Indicators
Source organization:
World Bank national accounts data, and OECD National Accounts data files.
Categories, topics:
Economy & Growth, Trade
Last updated:
apr 23, 2017
Indicators value changes by year
Minimum:
1.857 bln
jan 1, 1971
Maximum:
18.659 bln
jan 1, 2013
At the date of observation
Value
Absolute change
Change from previous value
jan 1, 1971
1.857 bln
+1.857 bln
0.0%
jan 1, 1972
2.256 bln
+398.597 mln
21.46%
jan 1, 1973
2.654 bln
+398.239 mln
17.65%
jan 1, 1974
3.258 bln
+604.203 mln
22.76%
jan 1, 1975
3.72 bln
+461.508 mln
14.16%
jan 1, 1976
4.252 bln
+531.829 mln
14.3%
jan 1, 1977
4.499 bln
+247.493 mln
5.82%
jan 1, 1978
4.635 bln
+136.098 mln
3.02%
jan 1, 1979
5.82 bln
+1.184 bln
25.55%
jan 1, 1980
6.377 bln
+557.344 mln
9.58%
jan 1, 1981
6.522 bln
+144.888 mln
2.27%
jan 1, 1982
6.565 bln
+43.463 mln
0.67%
jan 1, 1983
6.838 bln
+272.816 mln
4.16%
jan 1, 1984
7.224 bln
+386.154 mln
5.65%
jan 1, 1985
7.766 bln
+541.676 mln
7.5%
jan 1, 1986
7.726 bln
-40.363 mln
-0.52%
jan 1, 1987
7.687 bln
-38.285 mln
-0.5%
jan 1, 1988
8.295 bln
+607.88 mln
7.91%
jan 1, 1989
8.794 bln
+499.034 mln
6.02%
jan 1, 1990
8.422 bln
-372.208 mln
-4.23%
jan 1, 1991
8.662 bln
+239.982 mln
2.85%
jan 1, 1992
5.333 bln
-3.329 bln
-38.43%
jan 1, 1993
3.737 bln
-1.597 bln
-29.94%
jan 1, 1994
2.951 bln
-785.362 mln
-21.02%
jan 1, 1995
3.766 bln
+815.295 mln
27.63%
jan 1, 1996
4.078 bln
+311.42 mln
8.27%
jan 1, 1997
3.831 bln
-246.898 mln
-6.05%
jan 1, 1998
3.786 bln
-45.4 mln
-1.19%
jan 1, 1999
3.668 bln
-117.5 mln
-3.1%
jan 1, 2000
4.123 bln
+455.4 mln
12.42%
jan 1, 2001
4.319 bln
+195.4 mln
4.74%
jan 1, 2002
4.193 bln
-125.5 mln
-2.91%
jan 1, 2003
3.872 bln
-321.4 mln
-7.66%
jan 1, 2004
4.65 bln
+777.9 mln
20.09%
jan 1, 2005
6.121 bln
+1.471 bln
31.63%
jan 1, 2006
8.963 bln
+2.842 bln
46.43%
jan 1, 2007
9.87 bln
+906.8 mln
10.12%
jan 1, 2008
11.918 bln
+2.048 bln
20.75%
jan 1, 2009
12.506 bln
+588.5 mln
4.94%
jan 1, 2010
10.839 bln
-1.667 bln
-13.33%
jan 1, 2011
14.519 bln
+3.68 bln
33.95%
jan 1, 2012
17.319 bln
+2.8 bln
19.28%
jan 1, 2013
18.659 bln
+1.34 bln
7.74%
jan 1, 2014
18.593 bln
-66.3 mln
-0.36%
Ranking of countries by current statistics by years


Comments: