29
/
en
AIzaSyAYiBZKx7MnpbEhh9jyipgxe19OcubqV5w
April 1, 2024
266783
Trinidad and Tobago
TTO
true
2
1
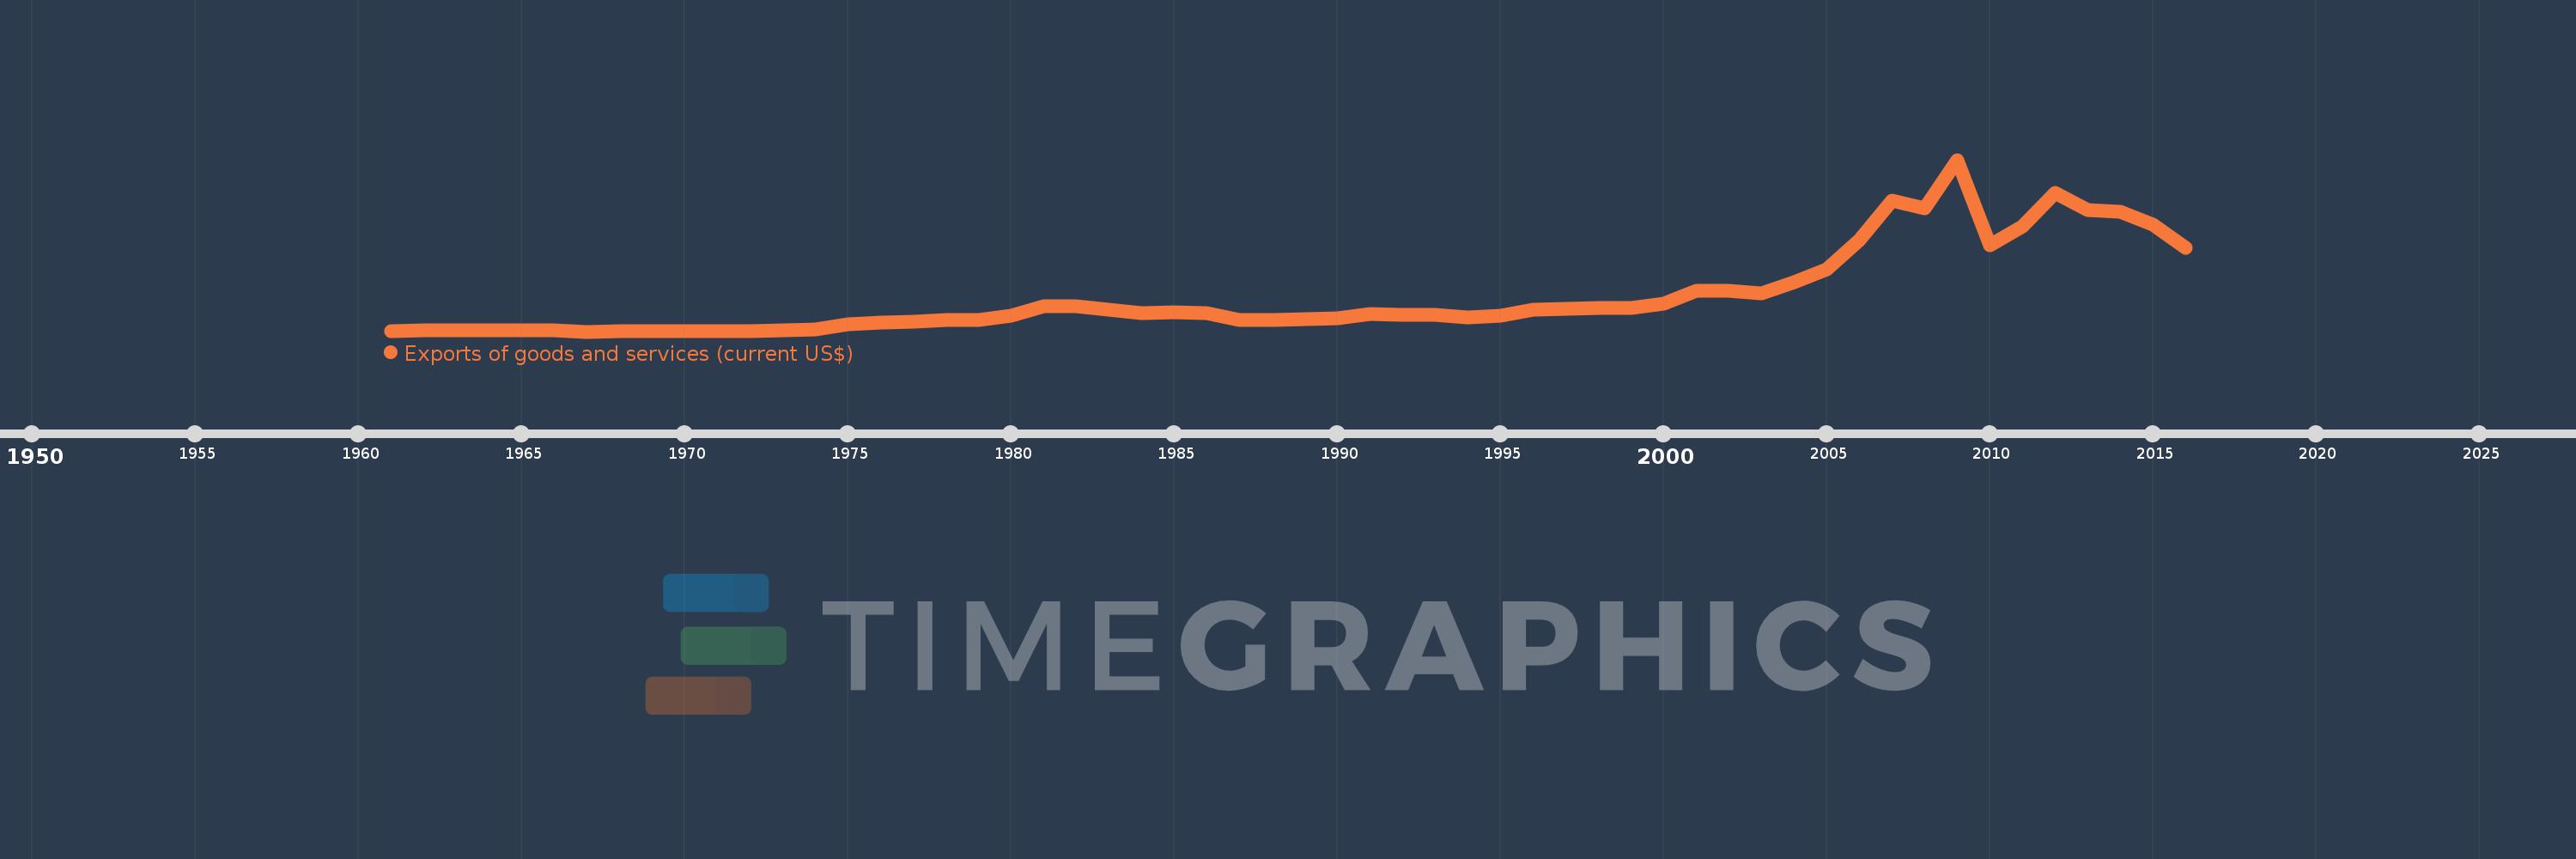
Exports of goods and services (current US$)
2016,2015,2014,2013,2012,2011,2010,2009,2008,2007,2006,2005,2004,2003,2002,2001,2000,1999,1998,1997,1996,1995,1994,1993,1992,1991,1990,1989,1988,1987,1986,1985,1984,1983,1982,1981,1980,1979,1978,1977,1976,1975,1974,1973,1972,1971,1970,1969,1968,1967,1966,1965,1964,1963,1962,1961
This statistics in other country:
AfghanistanAlbaniaAlgeriaAngolaAntigua and BarbudaArab WorldArgentinaArmeniaArubaAustraliaAustriaAzerbaijanBahamas, TheBahrainBangladeshBarbadosBelarusBelgiumBelizeBeninBermudaBhutanBoliviaBosnia and HerzegovinaBotswanaBrazilBrunei DarussalamBulgariaBurkina FasoBurundiCabo VerdeCambodiaCameroonCanadaCaribbean small statesCentral African RepublicCentral Europe and the BalticsChadChileChinaColombiaComorosCongo, Dem. Rep.Congo, Rep.Costa RicaCote d'IvoireCroatiaCubaCyprusCzech RepublicDenmarkDjiboutiDominicaDominican RepublicEarly-demographic dividendEast Asia & PacificEast Asia & Pacific (excluding high income)East Asia & Pacific (IDA & IBRD countries)EcuadorEgypt, Arab Rep.El SalvadorEquatorial GuineaEritreaEstoniaEthiopiaEuro areaEurope & Central AsiaEurope & Central Asia (excluding high income)Europe & Central Asia (IDA & IBRD countries)European UnionFaroe IslandsFijiFinlandFragile and conflict affected situationsFranceFrench PolynesiaGabonGambia, TheGeorgiaGermanyGhanaGreeceGrenadaGuatemalaGuineaGuinea-BissauGuyanaHaitiHeavily indebted poor countries (HIPC)High incomeHondurasHong Kong SAR, ChinaHungaryIBRD onlyIcelandIDA & IBRD totalIDA blendIDA onlyIDA totalIndiaIndonesiaIran, Islamic Rep.IraqIrelandIsraelItalyJamaicaJapanJordanKazakhstanKenyaKiribatiKorea, Rep.KosovoKuwaitKyrgyz RepublicLao PDRLate-demographic dividendLatin America & Caribbean Latin America & Caribbean (excluding high income)Latin America & the Caribbean (IDA & IBRD countries)LatviaLeast developed countries: UN classificationLebanonLesothoLiberiaLibyaLithuaniaLow & middle incomeLow incomeLower middle incomeLuxembourgMacao SAR, ChinaMacedonia, FYRMadagascarMalawiMalaysiaMaldivesMaliMaltaMauritaniaMauritiusMexicoMicronesia, Fed. Sts.Middle East & North AfricaMiddle East & North Africa (excluding high income)Middle East & North Africa (IDA & IBRD countries)Middle incomeMoldovaMongoliaMontenegroMoroccoMozambiqueMyanmarNamibiaNepalNetherlandsNew CaledoniaNew ZealandNicaraguaNigerNigeriaNorth AmericaNorwayOECD membersOmanOther small statesPacific island small statesPakistanPalauPanamaPapua New GuineaParaguayPeruPhilippinesPolandPortugalPost-demographic dividendPre-demographic dividendPuerto RicoQatarRomaniaRussian FederationRwandaSamoaSaudi ArabiaSenegalSerbiaSeychellesSierra LeoneSingaporeSlovak RepublicSloveniaSmall statesSolomon IslandsSomaliaSouth AfricaSouth AsiaSouth Asia (IDA & IBRD)South SudanSpainSri LankaSt. Kitts and NevisSt. LuciaSt. Vincent and the GrenadinesSub-Saharan Africa Sub-Saharan Africa (excluding high income)Sub-Saharan Africa (IDA & IBRD countries)SudanSurinameSwazilandSwedenSwitzerlandSyrian Arab RepublicTajikistanTanzaniaThailandTimor-LesteTogoTongaTrinidad and TobagoTunisiaTurkeyTurkmenistanUgandaUkraineUnited Arab EmiratesUnited KingdomUnited StatesUpper middle incomeUruguayUzbekistanVanuatuVenezuela, RBVietnamWest Bank and GazaWorldYemen, Rep.ZambiaZimbabwe Timeline:
This timeline shows a graph from 1961 to 2016 of Trinidad and Tobago. No data until 1960. Number of actual observations by date: 56.
Source name:
World Development Indicators
Source organization:
World Bank national accounts data, and OECD National Accounts data files.
Categories, topics:
Economy & Growth, Trade
Last updated:
apr 23, 2017
Indicators value changes by year
Minimum:
301.464 mln
jan 1, 1967
Maximum:
19.582 bln
jan 1, 2009
At the date of observation
Value
Absolute change
Change from previous value
jan 1, 1961
321.822 mln
+321.822 mln
0.0%
jan 1, 1962
406.988 mln
+85.166 mln
26.46%
jan 1, 1963
407.863 mln
+875.051K
0.22%
jan 1, 1964
435.221 mln
+27.358 mln
6.71%
jan 1, 1965
475.12 mln
+39.9 mln
9.17%
jan 1, 1966
475.471 mln
+350.639K
0.07%
jan 1, 1967
301.464 mln
-174.007 mln
-36.6%
jan 1, 1968
317.013 mln
+15.549 mln
5.16%
jan 1, 1969
324.35 mln
+7.337 mln
2.31%
jan 1, 1970
338.45 mln
+14.1 mln
4.35%
jan 1, 1971
351.5 mln
+13.05 mln
3.86%
jan 1, 1972
383.361 mln
+31.861 mln
9.06%
jan 1, 1973
428.98 mln
+45.619 mln
11.9%
jan 1, 1974
577.838 mln
+148.858 mln
34.7%
jan 1, 1975
1.158 bln
+580.208 mln
100.41%
jan 1, 1976
1.294 bln
+136.221 mln
11.76%
jan 1, 1977
1.396 bln
+101.866 mln
7.87%
jan 1, 1978
1.555 bln
+159.117 mln
11.4%
jan 1, 1979
1.569 bln
+13.833 mln
0.89%
jan 1, 1980
2.075 bln
+505.417 mln
32.21%
jan 1, 1981
3.139 bln
+1.064 bln
51.3%
jan 1, 1982
3.144 bln
+5.0 mln
0.16%
jan 1, 1983
2.789 bln
-354.583 mln
-11.28%
jan 1, 1984
2.346 bln
-443.333 mln
-15.89%
jan 1, 1985
2.44 bln
+93.75 mln
4.0%
jan 1, 1986
2.406 bln
-33.869 mln
-1.39%
jan 1, 1987
1.65 bln
-755.714 mln
-31.41%
jan 1, 1988
1.624 bln
-26.389 mln
-1.6%
jan 1, 1989
1.741 bln
+117.114 mln
7.21%
jan 1, 1990
1.832 bln
+90.804 mln
5.22%
jan 1, 1991
2.289 bln
+457.176 mln
24.96%
jan 1, 1992
2.18 bln
-108.941 mln
-4.76%
jan 1, 1993
2.144 bln
-35.671 mln
-1.64%
jan 1, 1994
1.854 bln
-290.569 mln
-13.55%
jan 1, 1995
2.104 bln
+250.729 mln
13.53%
jan 1, 1996
2.799 bln
+694.461 mln
33.0%
jan 1, 1997
2.815 bln
+16.591 mln
0.59%
jan 1, 1998
2.994 bln
+179.095 mln
6.36%
jan 1, 1999
2.93 bln
-64.643 mln
-2.16%
jan 1, 2000
3.42 bln
+489.913 mln
16.72%
jan 1, 2001
4.845 bln
+1.425 bln
41.67%
jan 1, 2002
4.908 bln
+62.816 mln
1.3%
jan 1, 2003
4.557 bln
-350.625 mln
-7.14%
jan 1, 2004
5.891 bln
+1.334 bln
29.28%
jan 1, 2005
7.254 bln
+1.363 bln
23.13%
jan 1, 2006
10.569 bln
+3.315 bln
45.7%
jan 1, 2007
15.031 bln
+4.462 bln
42.22%
jan 1, 2008
14.139 bln
-891.571 mln
-5.93%
jan 1, 2009
19.582 bln
+5.443 bln
38.5%
jan 1, 2010
9.987 bln
-9.596 bln
-49.0%
jan 1, 2011
12.113 bln
+2.126 bln
21.29%
jan 1, 2012
15.886 bln
+3.773 bln
31.15%
jan 1, 2013
13.948 bln
-1.938 bln
-12.2%
jan 1, 2014
13.757 bln
-191.517 mln
-1.37%
jan 1, 2015
12.308 bln
-1.449 bln
-10.53%
jan 1, 2016
9.686 bln
-2.622 bln
-21.3%
Ranking of countries by current statistics by years


Comments: